Vol 9, No 4 (2025)
https://doi.org/10.7577/njcie.6180
Article
How Do Teachers Use Digital Technology When They Engage Students in Mathematical Inquiry?
Roar Bakken Stovner
Oslo Metropolitan University
Email: roarbakken.stovner@oslomet.no
Ove Edvard Hatlevik
Oslo Metropolitan University
Email: ove-edvard.hatlevik@oslomet.no
Abstract
This paper addresses how digital technology is used during mathematical inquiry in Norwegian secondary school following the implementation of a new national curriculum in 2020. The curriculum emphasizes inquiry-based learning, while digital technology is widely available and frequently used in Norwegian education. We analyzed 95 video-recorded lessons, subdivided into 343 fifteen-minute segments, using observation instruments that capture both digital technology use and inquiry. The results were that segments featuring advanced use of digital technology were more likely to feature mathematical inquiry. During mathematical inquiry, dynamic geometry software and spreadsheets were the most used digital technologies, while computer algebra systems and programming environments were the least used. We also conducted a qualitative analysis of the functions that digital technology had for mathematical inquiry. On the one hand, digital technology enabled mathematical inquiry by efficiently drawing graphs, either by saving labor or by enabling visual reasoning before formal learning. On the other hand, digital technology sometimes shifted mathematical inquiry towards computational approaches and use of software features. These findings highlight both the potential and limitations of digital technology during mathematical inquiry, cautioning against overly simplistic views of their impact.
Keywords: mathematics, inquiry-based learning, digital technology, secondary school, teaching observation
Introduction
Educational reforms across the Nordic countries have increasingly emphasized inquiry-based teaching practices (Blomhøj et al., 2009), aligning with a global shift towards student-centered learning. The rapid digitalization of schools has introduced many new digital technologies into the classroom, presenting both opportunities and challenges for educators. Many students are experienced users of digital technologies for social purposes and entertainment. Yet, this digital competence for leisure activities is not always transferable into using digital technology for mathematical purposes, for example software for programming or dynamic geometry. This means that schools and teachers have an important role in showing students which digital technologies are relevant in mathematics and how these can be applied. Teachers must now manage to teach with inquiry in a classroom where students are equipped with individual digital devices and where students are expected to use their digital devices for most of their final mathematics exams.
While interest in digital technologies and inquiry-based teaching in mathematics has grown, there remains a gap in understanding how these two dimensions intersect in everyday classroom practice. Much of the existing research focuses on isolated interventions or idealized scenarios (see Drijvers & Sinclair, 2024; Ran et al., 2022) rather than routine teaching. In this context, Norway offers a unique setting to investigate how national policies emphasizing both inquiry and digital competence are realized in real classrooms. With near-universal student access to digital devices (Rohatgi et al., 2024) and a curriculum that explicitly promotes inquiry-based learning (Karseth et al., 2020), Norway provides an ideal case for studying how digital technology are being integrated into mathematics instruction.
We investigated how digital technology were used to support mathematical inquiry in Norwegian secondary classrooms in the years following the 2020 curriculum reform. This reform emphasized student-centered, inquiry-based learning alongside continued expectations for digital competence. Drawing on data from 95 mathematics lessons taught by 21 teachers across seven schools in three regions, we examine actual classroom practice rather than designed interventions. Our analysis is guided by three research questions:
RQ1: To what extent is digital technology used in mathematical inquiry in Norwegian secondary school?
RQ2: What digital technologies are used in mathematical inquiry in Norwegian secondary school?
RQ3: What functions does digital technology have in mathematical inquiry in Norwegian secondary school?
Inquiry in Mathematics
Inquiry in education refers to a student-centered approach that encourages exploration, questioning, and discovery as central to the learning process (Dorier & Maass, 2014). With inquiry, teachers try to avoid passive reception of information and promote active engagement, where students construct their understanding through investigations. Inquiry often unfolds in phases (Pedaste et al., 2015), including a preparatory phase where questions and objectives are established, an investigation phase where students explore and gather information, and a consolidation phase where findings are analyzed and synthesized to draw conclusions.
In the context of mathematics, inquiry-like concepts have been researched under many different terms, like problem-solving, modelling, adidactical situations, realistic mathematics education, and more (Artigue & Blomhøj, 2013). Although there are no agreed-upon conceptualization of inquiry in mathematics, there are some central points that characterize mathematical inquiry in all the approaches mentioned, that questions feel authentic to students (whether they are real-life questions or abstract mathematical questions), that autonomy and responsibility are given to students (in which mathematical questions they pursue and how they investigate them), and that the investigations give the chance to develop important mathematics.
One of our goals was to study the functions the digital technologies had during mathematical inquiry. We were interested in several functions that digital technologies might have, such as its function in transforming what content is to be learned, how students interact with the content, how students interact with each other, and how the teacher works with the content and the students (Trgalová & Tabach, 2023).
Digital Competence and Digital Technology in Mathematics
Digital technology offers opportunities for teaching and learning; however, their effective use requires guidance and training in digital competence (Timotheou et al., 2023). Reviews and meta-studies recognize the potential for learning through the introduction of digital technologies in education (Cevikbas et al., 2023; Hillmayr et al., 2020; Ran et al., 2022). Yet, access to digital technology might not be sufficient, the students need guidance and training to develop the required digital competence (Gudmundsdottir et al., 2024; Kure et al., 2023). Digital competence is a broad term that covers skills (such as using various software), knowledge (such as understanding what is the most appropriate software), and attitudes (e.g. for making ethical judgments). Digital competence ranges from searching, finding and evaluating information to communicating, developing and producing content or procedures (Gudmundsdottir et al., 2024).
Drijvers and Sinclair (2024) argue that mathematics learning can be improved using digital technology. This statement is based on two meta-studies (Hillmayr et al., 2020; Young, 2017) which show that measures with digital technologies can explain better learning outcomes in mathematics. Yet, other researcher state that there are advantages and challenges with digital technology when teaching students about how to solve mathematical modelling (Cevikbas et al., 2023).
Although experimental studies can produce positive effects, these studies do not provide explanations for why, how, when or for whom digital technologies work. We need a different approach to understand the role digital technologies can play in teaching mathematics and learning to solve mathematical problems. Drijvers and Sinclair (2024) highlight the importance of examining different perspectives on learning with digital technology. They believe that this can help us understand how to design and use digital technology in learning. Integration of technology in teaching requires competence on the part of teachers and students. It can be a challenge when it comes to access and opportunities for using technology in teaching and learning (Weigand et al., 2024).
Drijvers (2015) argues that three factors are important when using digital technology in mathematics education, namely design, the teacher's role, and the learning context. It is necessary to design a teaching plan to connect technology, content and subjects in a good learning environment. When integrating digital technology, the role of the mathematics teacher becomes important, because the teacher must monitor and follow up the activities and learning work. It requires that the teacher develops technological and pedagogical knowledge. Thirdly, practical work in the learning context is important for how to succeed in using digital technology in mathematics teaching.
Over time, there have been changes in the mathematics curriculum in terms of topics, working methods and forms of assessment. For example, digital technology is now allowed to be used in parts of examinations in Norwegian schools (Erstad et al., 2021; Kure et al., 2023), see also recommendations developed by the Norwegian Centre for Mathematics Education (Stengrundet, 2019). The integration of digital technologies in written exams at secondary schools has implications for the digital competence teachers and students must develop to be prepared for the exams in mathematics. The ability to use digital technology and develop a digital competence is embedded in the Norwegian curriculum (Kure et al., 2023). There are specific competence aims for each year of secondary school, and the ability to use digital technology in solving mathematical problems are explicitly mentioned in several competence aims. This means that using digital technology is relevant based on both the overall objective and specific goals (Kure et al., 2025).
The Norwegian Centre for Mathematics Education has developed examples of how teachers can find and use relevant digital technology, emphasizing that GeoGebra (with built-in features as graph plotter, CAS, spreadsheets and dynamic geometry) and Microsoft Excel (spreadsheets) can be useful when learning mathematics in secondary school (Leer & Stengrundet, 2023). When using digital technology in mathematical inquiry, it is not sufficient to simply state the answer to a solution. Answering this type of problem requires that students document their understanding of the problem, which technology they have chosen, and show how they solved the problem. Digital technology for editing makes it possible for students to take clippings from spreadsheets, dynamic geometry, graph plotters and/or CAS to insert this into the answer together with descriptive and explanatory text (Leer & Stengrundet, 2023; Zhang et al., 2025).
The Context of Mathematics Education in Norway’s Digital Classrooms
Norway requires 10 years of compulsory education from ages 6 to 16, with lower secondary beginning in Year 8. Students then receive three additional years of upper secondary education. Mathematics is mandatory throughout compulsory schooling and for one or two years of upper-secondary schooling, one year for vocational students and two years for academic students. Students choose between practical and theoretical mathematics tracks when entering upper secondary school. Additionally, arithmetic is integrated as a basic skill across all subjects and years.
Inquiry has long been a central focus in the Norwegian mathematics curriculum. However, in the revised LK20 curriculum, it has received even greater emphasis, both as a core competency of mathematics (Norwegian: utforsking) and as the most frequently used verb (Norwegian: utforske) in the curriculum’s competency aims (Karseth et al., 2020). For example, one of the aims states, “Students shall know how to inquire into and describe prime factorization and its use in fraction calculations.”
In recent years, Norway has made significant progress in digitalizing its educational system. By 2021, nearly all students in lower secondary education (98%) were equipped with individual digital devices (Munthe et al., 2022). The digitalization of schooling is frequently discussed in Norwegian media, often in a polarized manner, but recent classroom studies (e.g., Aashamar et al., 2021; Gudmundsdottir et al., 2024; Kure et al., 2023), do not indicate an uncritical or unchecked use of digital technology in schools. Digital technologies are explicitly mentioned in several competency aims in mathematics, such as in “students shall know how to inquire into and compare the properties of various functions by using digital technology”. Digital competence is also a basic skill that should be addressed across all years and subjects.
Norwegian mathematics exams rely heavily on digital technology, also for inquiry. Students have up to one hour to complete the first part, in which they are not allowed to use digital technology, but they have up to five hours for the remaining part where they are allowed to use digital technology and which measures students’ skill in core competencies such as inquiry. In these exams, students can profit from knowing graphing calculators, spreadsheets, computer algebra systems, dynamical geometry software, and a programming environment.
Method
This study is part of a longitudinal project, EDUCATE (Brevik et al., 2023), aimed at examining naturalistic teaching practices after the implementation of the LK20 curricular reform in Norwegian secondary schools. The project investigates practices across seven subjects and with several data sources, but in this article, we only report about mathematics and the video-recorded lessons and the coding conducted with the observation instruments for inquiry teaching and the teaching of digital competence. Our mixed methods approach incorporates quantitative and qualitative analyses of video-recorded lessons to highlight the presence and characteristics of classroom practices involving the use of digital technology when teachers engage students in mathematics across seven Norwegian secondary schools.
Sampling procedure
Over three years (2021–2024), a total of 95 mathematics lessons were video-recorded from 7 schools, 21 teachers and 26 classes. (Some of these were double lessons, so this has been reported as 117 lessons in project reports, e.g. (Some of these were double lessons, so this has been reported as 117 single lessons in some project reports, e.g., Stovner et al., 2025) Four schools were lower secondary schools, and 3 were upper secondary schools. Schools were sampled to include variation across key demographic factors in Norwegian schooling, geography (urban/rural), diversity and variation in student performance on national tests (Brevik et al., 2023). From within schools, teachers who were willing to be filmed for a study about the teaching under the new curriculum were recruited. We filmed upper secondary classes (Year 11) and lower secondary classes (Year 8) in the school year 2021–2022. We aimed at filming the same lower secondary classes in 2023–2024 (now in Year 10) as in 2021–2022, but one class dropped out. Two of the classes were still taught by the same teacher when we filmed in 2023–2024, and the other classes were filmed with their new teacher. Some students had changed schools, but the classes were mostly intact. Upper secondary mathematics classes were filmed only in 2021–2022.
Table 1. Number of schools, teachers, classes and lessons filmed in total and for each Year
|
|
Year 8 |
Year 10 |
Year 11 |
Total |
|
Schools |
4 |
3 |
3 |
7 |
|
Teachers |
8 |
5 |
10 |
21 |
|
Classes |
12 |
6 |
14 |
26 |
|
Lessons |
33 |
25 |
37 |
95 |
Note. The numbers sum to more than the total because some classes and schools were filmed in both Year 8 and 10, and because some teachers taught more than one class.
Video-Recording Lessons in Mathematics
In the project, the video data was collected without giving the teachers any guidance or instruction on how to teach. Participating teachers were asked to implement their mathematics teaching plans without adapting their teaching methods or content for the project. We aimed at filming four consecutive lessons from each classroom to gain a more comprehensive sample of the teachers’ teaching and enable analyses of how teachers string lessons together, following the methodology of previous naturalistic classroom observation studies (Klette et al., 2017). The recordings took place at different times during the school year since we needed to use the same equipment at each school. We scheduled filming at times convenient for both our research team and the schools, avoiding the very beginning and end of the academic year to prevent disruption during student orientation and exam preparation periods.
The recorded lessons ranged from 30 to 90 minutes and covered various topics from Norway’s national mathematics curriculum. Lessons of 90 minutes were considered a double lesson and counted as two lessons. We used video recordings to enable deeper analysis through repeated viewing and to create an audit trail that could be evaluated and verified by our research team and other researchers (Brevik et al., 2023; Skarpaas & Dodou, in process). To ensure high-quality data capture, we used two cameras and a minimum of two microphones simultaneously: one lapel microphone on the teacher and one or two microphones placed among students, one camera at the front of the classroom capturing the students, and a second camera at the back capturing the teacher and board. More details about the video-recordings can be found in the project’s methodological report (Brevik et al., 2023).
Coding Instruments and Procedures
The 95 mathematics lessons were divided into fifteen-minute segments. If the last segment of a lesson lasted less than 7 minutes and 30 seconds, it was coded as part of the previous segment. This gave us 343 fifteen-minute segments.
In step 1, we coded each segment of the mathematics lessons to identify inquiry in the lessons. We coded with an observation instrument (developed in Brevik et al., 2024) that captured how the teacher provided instruction about inquiry or gave students opportunities for inquiry. The instrument operationalizes inquiry broadly, being designed to be used across subjects and age groups. Inquiry, as defined by the instrument, may involve one or more phases, preparation, investigation, and consolidation. What separates inquiry from other learning processes is that students try to find something out, that student activity is not reproductive, merely trying to reproduce what the teacher has shown, and that students have some autonomy, either in choosing which questions to pursue or how to pursue them. The instrument has four categories, see Table 2. Category 1 means that the teacher did not give instructions about inquiry or gave students opportunities for inquiry. Category 2 means that inquiry was present, but without requiring the student to analyze, reason, or interpret. In category 3 there is explicit use of inquiry with analysis, reasoning and interpretation. Category 4 has advanced use of inquiry giving student freedom to choose between different forms of inquiry.
In step 2, we coded each segment to evaluate the use of digital competence, based on an instrument described by Gudmundsdottir et al. (2024). This instrument measures teaching for digital competence, encompassing the teaching of skills for using digital technology, knowledge about digital technology, as well as instruction on digital responsibility (i.e., legal, ethical, and social considerations related to digital technology). These broader considerations on digital responsibility were absent in the mathematics lessons (which is an interesting finding in its own right), so the instrument effectively captured the use of digital technology. The instrument has four categories, see Table 2. Category 1 indicates no observation of digital competence. Category 2 means that teachers model the use of digital technology or instruct students about digital responsibility. Category 3 shows for example that teachers model varied use of digital technology or ethical considerations. Whereas category 4 indicates that teachers model advanced use of digital technology or responsibility.
All segments were coded by the first or second author. To ensure reliability, the research project mandated double coding 20 % of the segments early in the coding process to ensure that 80 % exact agreement was reached. We selected lessons from all Year levels and as many teachers as possible for double coding. The authors coded the segments for double coding separately without discussing their coding. Both codes reached higher agreement than the cutoff, 80 % for the mathematical inquiry code and 84 % for the digital competence code.
Table 2. EDUCATE An observation protocol for measuring the teaching of inquiry and digital competence
|
|
1 No observation of |
2 Presence of |
3 Explicit use of |
4 Advanced use of |
|
Inquiry |
Teacher does not provide instruction about, or opportunities for, student inquiry. |
Teacher provides instruction about, or opportunities for, student inquiry that does not demand analysis, reasoning, or interpretation. |
Teacher provides instruction about, or opportunities for, student inquiry that requires analysis, reasoning, or interpretation. |
Teacher provides instruction about, or opportunities for, student inquiry that requires analysis, reasoning, or interpretation. Students are free to choose different forms of exploration. |
|
Digital competence |
Teacher does not use and does not provide opportunities to use digital technology to gather information, for production, communication or to conduct digital responsibility. |
Teacher models simple use or provides opportunities for students’ simple use of digital technology for search and navigation, production or communication.
Or: instruction about rules or procedures in how to conduct digital responsibility. |
Teacher models varied use or provides opportunities for students’ varied use of digital technology for search and navigation, production or communication.
Or: instruction about legal, ethical or social considerations by use of digital technology or resources.
|
Teacher models advanced use or provides opportunities for students’ advanced use of digital technology for search and navigation, production or communication.
Or: Teacher provides opportunities for students to make legal, ethical or social considerations by using digital technology or resources. |
Note. EDUCATE Relevant observation protocol version 1.1 (Brevik et al., 2024; Gudmundsdottir et al., 2024).
Constructing a Subsample of Segments with Mathematical Inquiry Using Digital technology
Steps 1 and 2 enabled us to sample only the segments that included both mathematical inquiry and digital competence for further analysis. Drawing on previous findings from the project about inquiry and digital competence (Brevik et al., 2024; Gudmundsdottir et al., 2024), we selected segments rated 3 or 4 in both categories. The cutoff value of 3 was chosen because segments rated 2 did not adequately capture the type of teaching relevant to our research questions.
Segments rated 2 for inquiry typically involved students solving tasks using known solution methods, with only occasional signs of mathematical inquiry. Similarly, segments rated 2 for digital competence primarily featured students using digital textbooks or entering their solutions into some webpage, without employing digital technology for their inquiry. As a result, segments rated 1 or 2 on any category were excluded from further analysis.
The selected subsample formed the basis for steps 3 and 4, which focused on examining the types of digital technology used during mathematical inquiry and the functions these technologies served.
Identifying the Digital Technologies Used and Describing their Functions
Observations were documented and analyzed using Microsoft Excel. The spreadsheet was organized with lesson segments as rows and various variables of interest as columns. The spreadsheet contained variables with background information about the segment, such as the year, school, and class. To provide context and facilitate navigation within the dataset, the second author added a lesson name (e.g., “Modelling of Volleyball Serve Lesson”), a brief description of the lesson, and the types of digital technologies used (dynamical geometry software, spreadsheet software, computer algebra software, programming software, and other software).
Last, we conducted a reflexive thematic analysis (Braun & Clarke, 2006) of the functions digital technology had during mathematical inquiry. This approach involved that we, during the analysis, continuously reflected on our data, initial codes, and our evolving theoretical understanding, and that the outcome of the analysis was a set of themes that we created. The analysis was inductive, with initial codes closely describing the data, and grounded in a critical realist epistemology (Fryer, 2022; Isaksen, 2024). That is, we believe digital technologies have real and objective functions during mathematical inquiry (ontological realism), that observations of these functions are influenced by the observer (epistemic relativism), while maintaining that different observers can rationally determine which themes best explain the technologies' functions (rational judgment). The first author conducted the analysis, while the second author, who had also viewed all videos, provided critique and helped develop the final themes.
We made some deviations from Braun and Clarke’s (2006) thematic analysis process to better suit video-recorded data of teaching. First, instead of assigning codes to short excerpts of a transcript, we assigned codes to each segment, because the functions of digital technologies were only evident over longer timespans. For example, an initial code could read “use sliders in GeoGebra to draw many graphs of volleyball serves modelled by a quadratic”. Second, we reconceptualize themes not as “repeated patterns of meaning,” since the functions of digital technologies are not “meanings” per se. Instead, our themes represent regularities in how teachers and students interacted with mathematics using digital technology. Consequently, our themes are “latent” (Braun & and Clarke, 2021), offering theoretical accounts of the digital technologies’ functions during mathematical inquiry rather than being mere data-summaries. We arrived at the final themes by iteratively attempting broader codes like “use graph drawing software to efficiently explore the parameter space” before deciding on final themes such as “Digital technologies enabled mathematical inquiry by efficiently drawing graphs”.
Research ethics
The project has been approved from the national authority in the field to conduct the study with video observations by the Norwegian Agency for Shared Services in Education and Research. Participation was voluntary for students and teachers. All teachers, students and parents of students under 15 provided a written consent having the possibility of changing your mind at any time and withdrawing from the study without consequences, in line with ethical guidelines (National Committee for Research Ethics in the Social Sciences and the Humanities, 2021). Storage and analyses have been carried out in accordance with applicable requirements. School, teachers and students were pseudoanonymized.
Results
The extent to which digital technology was used during mathematical inquiry
The 95 lessons comprised 343 fifteen-minute segments, all of which were coded using an observation instrument for inquiry and one for digital competence. Nearly half of the segments (142 segments, 41%) were scored at level 3 or 4 for inquiry, while a quarter (87 segments, 25%) received a score of 3 or 4 for digital competence. Additionally, one in eight segments (44 segments, 13%) achieved a score of 3 or 4 on both inquiry and digital competence, which formed the subsample that we analyzed qualitatively.
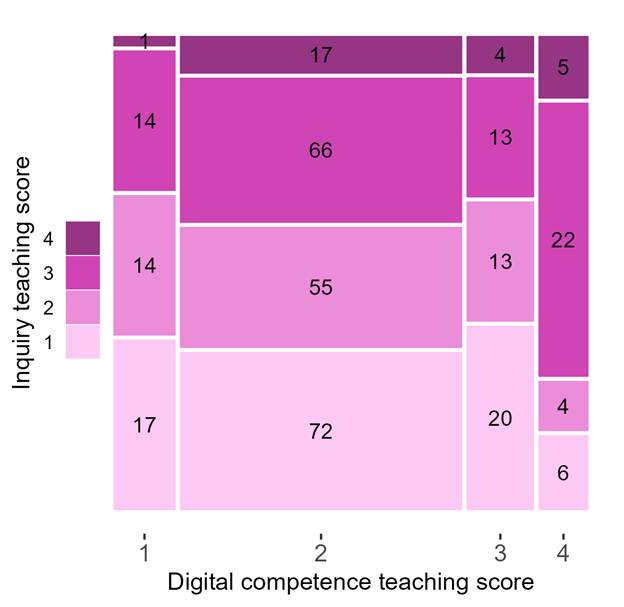
Mathematical inquiry occurred more frequently when digital technology use was advanced. The overview in Figure 1 shows that mathematical inquiry at a high level (score 3 or 4) occurs in more than three out of four segments with advanced use of digital competence (score 4). Mathematical inquiry at a high level is much rarer for less advanced use of digital competence (score 1, 2, and 3), occurring in about one in three segments. However, since high-level use of digital competence was quite rare, most inquiry in absolute terms (98 segments) was seen in segments where digital technology were used in a simple fashion or not at all (score 1 and 2).
Figure 1. Number of 15-minute lesson segments for each combination of inquiry teaching score and digital competence teaching score. Areas are proportional to the number of segments.
We now turn to the analysis of the 44 segments with score 3 or 4 on both inquiry and digital competence.
The digital technologies used in mathematical inquiry
We took notes of the digital technologies used in the segments with high scores (3 or 4) on both digital competence and inquiry. The digital technologies used are presented in Table 3.
Graphing calculators were the most frequently used digital technology during mathematical inquiry, and the only graphing software used was GeoGebra. Graphing calculators were used almost exclusively in modelling tasks, where real-world phenomena were modelled with a function that the students primarily worked with graphically and not algebraically. Graphing calculators were used in all year groups (year 8, 10 and 11).
Table 3. Digital technologies used in the mathematics lessons
|
Digital technology |
Lessons |
Segments |
Comment |
|
Mathematical |
|
|
|
|
Graphing calculator |
10 |
20 |
GeoGebra in all cases. |
|
Spreadsheet (in GeoGebra for regression) |
8 |
17 |
Very frequent use in two classes |
|
Spreadsheet (in Microsoft Excel) |
5 |
10 |
Budgeting and accounting, and learning to use the tool |
|
Programming environment |
2 |
3 |
Two lessons with python |
|
Calculator |
1 |
2 |
|
|
Dynamic geometry software |
0 |
0 |
|
|
Computer algebra system |
0 |
0 |
|
|
Non-mathematical |
|
|
|
|
Web browsers |
5 |
7 |
Collect data from Statistics Norway and use python interpreters |
|
Presentation software |
1 |
2 |
Microsoft PowerPoint |
|
Word processor |
? |
? |
Mentioned in many lessons but rarely seen. Hard to count number of lessons and segments. |
Two different spreadsheet software packages were used, Microsoft Excel and GeoGebra, and GeoGebra was the most used spreadsheet software. This might be a coincidence in our data because two classes in the same upper secondary school used it for all lessons we recorded; and Excel is probably more commonly used, because Excel is more powerful and more user-friendly than GeoGebra’s spreadsheet implementation. The spreadsheet function of GeoGebra was only used to perform regressions, and only in the theoretical mathematics track. Microsoft Excel was used in budgeting and accounting tasks, and, in two lessons, in tasks whose only goal was to learn the functions of Excel.
Students used programming software in two lessons, one in year 8 and one in year 11. Here, they used the online Python interpreter provided by www.replit.com. In the year 8 lesson, the goal was to learn elementary programming concepts, and in the year 11 lesson, one group of students used it to (unsuccessfully) solve a mathematical problem.
We found no use of dynamic geometry software or computer algebra systems. It is not surprising that we did not find dynamic geometry software, as the curriculum contains little to no geometry for the age groups we filmed. Students also used various other digital technologies such as presentation software for presenting their work, cloud storage tools to organize files, note taking tools such as word processors, and web browsers for collecting data from Statistics Norway (or accessing the already mentioned Python interpreters).
The function of digital technology in mathematical inquiry
We created four themes to describe the functions digital technology had in mathematical inquiry. Digital technologies
· enabled mathematical inquiry by efficiently drawing graphs.
· shifted the mathematical inquiry towards computational approaches and use of software features.
· introduced new mathematical content.
· improved the consolidation phase of mathematical inquiry.
Below, we describe each theme in turn.
Digital technology enabled mathematical inquiry by efficiently drawing graphs
In six lessons (nine segments), digital technology enabled mathematical inquiry by drawing graphs efficiently. In most cases, students needed digital technology in their inquiry because analog methods would be too labor intensive, but in some cases, digital technology enabled students to reason visually before learning mathematics formally.
An
illustrative example is the surprise party task, see Panel 1, which would be
too labor intensive to inquire deeply into without digital technology. For this
task, which was taught in Year 10 (15–16-year-olds), pairs of students had to
compare different alternatives for organizing a party. The vast number of
alternatives made it intractable to compare them all, so students had to carefully
select alternatives to compare. Because the number of guests was uncertain,
students (often prompted by the teacher) had to draw graphs of the price per
person on the ![]() -axis and the number of guests on the
-axis and the number of guests on the ![]() -axis.
The digital technology they used was the geometry software GeoGebra.
-axis.
The digital technology they used was the geometry software GeoGebra.
|
Panel 1. Surprise party task |
|
The teacher announced that he wanted to host a surprise party for a colleague’s birthday, and that he had researched different ways of organizing it. Now he needed help in deciding which way was the best. The teacher showed the students different venues in which they could host the party, and the venues differed in maximum capacity, pricing scheme (fixed cost or per person), whether food and drink was included, whether you had to clean it yourself, opening times, whether it had a sound system, etc. He also showed alternative ways of providing food, like catering firms. The teacher also had some criteria for what he considered a good party (at least 30 guests but more was better; food had to be served; drinks available; etc.). The main criterion was the price per guest. |
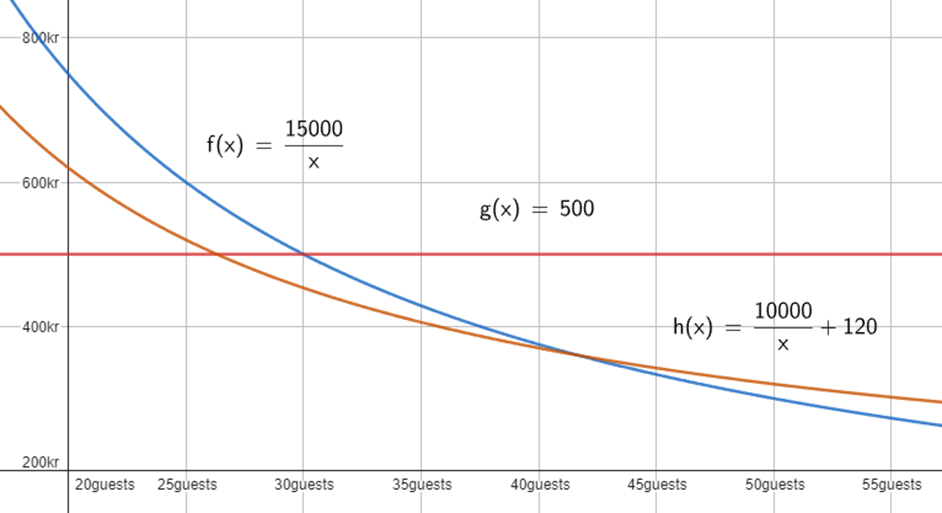
Students drew
graphs similar to those in Figure 2 and used them interactively to
explore different scenarios. For instance, they quickly adjusted the graph of ![]() from
from ![]() to
to ![]() to evaluate
how adding a NOK 3000 cleaning service after the party would affect the price
per person. Without digital technology, comparing multiple options for all
possible number of guests would have been cumbersome, and hand-drawn graphs
lack the flexibility to interactively explore different scenarios.
to evaluate
how adding a NOK 3000 cleaning service after the party would affect the price
per person. Without digital technology, comparing multiple options for all
possible number of guests would have been cumbersome, and hand-drawn graphs
lack the flexibility to interactively explore different scenarios.
Figure 2. The type of graphs students would draw in the “surprise party” task. This figure was drawn by the authors based on student work in the observed lessons.
In the surprise party task, the students
could conceivably have explored the task without digital technology, although
in a more limited way. But sometimes, students would have to learn a lot of new
content before being able to explore the tasks. An example was a volleyball
serve task, also taught in Year 10. The teacher informed the students that quadratic
functions modelled projectile trajectories well, and that they would use this
information to find the optimal volleyball serve. The teacher showed a figure
of facts about volleyball court, including that it is 18 m long and that the
net is 2,40 m high, and said that students can serve from 2,00 m above ground
level. The teacher said that another class had found that the optimal serve was
found by the expression ![]() , but
challenged the class to find a better serve with GeoGebra.
, but
challenged the class to find a better serve with GeoGebra.
To solve this task, the students could have
imposed the restrictions that the ball was served from maximum height (![]() when
when
![]() ), just grazed the net (
), just grazed the net (![]() when
when
![]() ), and landed at the far end of the court (
), and landed at the far end of the court (![]() when
when
![]() ). To solve this, they could possibly have solved a set of equations,
but as they were just learning about quadratic functions and just had learned
to solve sets of equations, this would have been beyond the reach of most or all
students in the class. Instead, students could explore the task with the
digital technology, GeoGebra, where students created gliders for each coefficient.
The students could happily report that they found better serves than the other
class. The graphing calculators removed much algebraic work, but they sometimes
led to new questions that were solved algebraically, such as when one student
noted that it would be better to serve across the diagonal length of the court,
and the students eagerly used the Pythagorean theorem to find its length.
). To solve this, they could possibly have solved a set of equations,
but as they were just learning about quadratic functions and just had learned
to solve sets of equations, this would have been beyond the reach of most or all
students in the class. Instead, students could explore the task with the
digital technology, GeoGebra, where students created gliders for each coefficient.
The students could happily report that they found better serves than the other
class. The graphing calculators removed much algebraic work, but they sometimes
led to new questions that were solved algebraically, such as when one student
noted that it would be better to serve across the diagonal length of the court,
and the students eagerly used the Pythagorean theorem to find its length.
Digital technology shifted the mathematical inquiry towards computational approaches and use of software features
In eight lessons (twelve segments), digital technology removed the mathematical point from the inquiry by creating computational solutions or using ready-made software features. By removing the mathematics from the inquiry, we mean that students could not practice the relevant competency goals in the national mathematics curriculum in the inquiry.
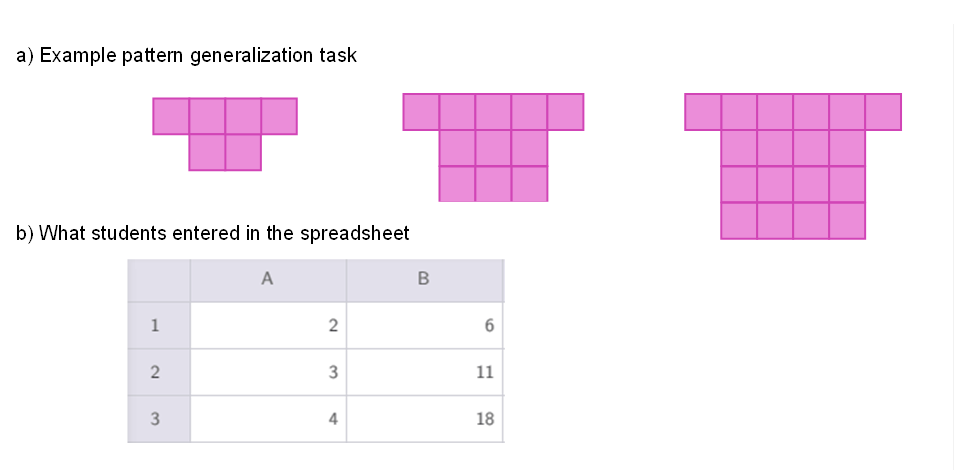
In many of these lessons, students solved pattern
generalization tasks, which involve describing the growth of a pattern with an
algebraic expression. In a theoretical math class in Year 11, the first year of
upper secondary school (16–17-years-old), students were presented with the task
of finding the algebraic expression describing the number of tiles in the ![]() th figure in the sequence shown in Figure 3a. Without digital technology,
students reasoned that figure
th figure in the sequence shown in Figure 3a. Without digital technology,
students reasoned that figure ![]() had
a square of size
had
a square of size ![]() , resulting in the expression
, resulting in the expression ![]() . That
is, they reasoned about the correspondence between
. That
is, they reasoned about the correspondence between ![]() and
the sequence and about its quadratic growth.
and
the sequence and about its quadratic growth.
When students were shown how to solve such
problems with regression in GeoGebra, they made mistakes. They entered data as
in Figure 3b, indexing the
figure with six tiles as ![]() instead
of
instead
of ![]() . They then tried different options in the regression menu, finding
that the setting “quadratic regression” fit the points perfectly. That is, students
showed no signs of having thought about the correspondence between
. They then tried different options in the regression menu, finding
that the setting “quadratic regression” fit the points perfectly. That is, students
showed no signs of having thought about the correspondence between ![]() and the
sequence and about its quadratic growth. This led to mistakes. GeoGebra found the
expression
and the
sequence and about its quadratic growth. This led to mistakes. GeoGebra found the
expression ![]() ,
which was valid for the students’ incorrect indexing, but when students were
asked about how many tiles there were in figure
,
which was valid for the students’ incorrect indexing, but when students were
asked about how many tiles there were in figure ![]() ,
they answered incorrectly, and they struggled to understand the teacher’s
explanations that they needed to substitute
,
they answered incorrectly, and they struggled to understand the teacher’s
explanations that they needed to substitute ![]() in their
expression.
in their
expression.
Figure 3. An example of a typical pattern generalization task and what some students entered into their spreadsheet software to solve it
The example illustrates how digital technology shifted mathematical inquiry away from the mathematical point and towards computational approaches and use of software features, but it also demonstrates how the technology itself is misrepresented. Regression is designed to find the line of best fit when lines cannot be fit exactly, not to derive expressions that fit the points perfectly. Using regression for pattern generalization tasks thus misrepresents the tool. This occurred in two schools in different regions, suggesting that using regression for pattern generalization tasks might be common, although regression is not mentioned in the curriculum.
Another digital technology worth noting here is programming. In one lesson in Year 11, some students tried to solve the classic “100 lightbulbs” problem[1] through programming. This problem is elegantly solved by analyzing patterns in the divisors of the integers. However, the students who programmed focused on brute-forcing a solution, failing to engage with mathematics. Consequently, they were the only students in the class who neither solved the problem nor explored the underlying mathematical point about divisors.
Digital technology improved the consolidation phase of mathematical inquiry
In three lessons (three segments), digital technology improved the consolidation phase by facilitating the sharing of student work and instantly showing the effect of feedback. An illustrative example occurred during the consolidation phase of the “surprise party task”, see Panel 1. Students connected their computers to a projector, allowing the entire class to view their work. As the students presented their work, classmates asked questions, and the teacher gave feedback. The presenting students could immediately revise their graphs, demonstrating in real-time how the suggestions impacted their work. This approach allowed both the presenters and the class to observe how the feedback improved work instantly. We also observed this improvement of the consolidation phase with spreadsheets, where cell references made small changes propagate to the entire sheet, instantly showcasing the effect of the feedback to students.
Digital technology introduced new mathematical content
Across nine lessons (eighteen segments), the digital technology necessitated mathematics that was not mentioned in the national mathematics curriculum for that mathematics course, and thus, the digital technology functioned to introduce new mathematical content. Most common was the regression tool in GeoGebra, which was used in eight lessons (seventeen segments) and was described above. Also, one Year 10 class (15-16-year-olds) briefly covered Boolean expressions, in particular how to use the logical “AND” operator.
Discussion
Our aim was to investigate how digital technology were used in mathematical inquiry in Norwegian secondary schools in three years following the curriculum reform of 2020. We found that, across the 95 lessons, advanced mathematical inquiry was most common in segments that had advanced use of digital technology, and that the most commonly used digital technology during mathematical inquiry were graphing calculators and spreadsheets. Digital technology functioned to enable inquiry by efficiently drawing graphs and to shift the mathematical inquiry towards computational approaches and use of software features. They also introduced some new mathematical content and improved the consolidation phase.
Digital technology is neither a curse nor a salvation for mathematical inquiry
While we observed digital technology enabling productive mathematical inquiry, we also saw instances where it undermined mathematical points and shifted focus toward ready-made software solutions. This duality highlights the futility of black-and-white thinking about digital technology in mathematics education. Following Drijvers (2015), we discuss when and how digital technology use was beneficial and detrimental for mathematical inquiry.
We found that advanced inquiry was more common in lessons with advanced digital technology use, but the causes of this correlation remain unclear. Our study doesn't support the simple conclusion that introducing more digital technology directly causes more inquiry-based teaching. Alternative explanations include Norway's exam structure—featuring sections with extensive inquiry where using digital technology is allowed—which may motivate teachers to pair digital tools with inquiry tasks for exam preparation. Also, teachers might find it easier to teach mathematics with inquiry using digital technology, or students might be better able to use inquiry when supported by digital technology.
Digital technology served two beneficial functions during inquiry. First, it helped mathematical inquiry by quickly generating graphs, eliminating time-consuming manual drawing and allowing deeper exploration. This enabled students to explore problems before learning solution procedures, as in the volleyball serve task—mirroring Heid's (1988) classic experiment where exploration before procedures led to greater conceptual understanding of college calculus.
Second, digital technology enhanced consolidation by allowing students to present work on public screens. When receiving feedback, students could immediately revise their work with graphs automatically redrawn, resembling Trouche's (2004) "sherpa-student orchestration." Notably, while these functions required researcher intervention in the earlier studies by Heid (1988) and Trouche (2004), our data showed teachers implementing these approaches independently.
However, not all functions were beneficial. For pattern generalization tasks, the technology's functionality often supplanted rather than supported the development of important mathematical concepts.
A need for disseminating better methods in using digital technology for pattern generalization tasks
We observed many mathematics lessons with pattern generalization tasks in which digital technology was used, but we saw no digital technology being used for expressing the growth of the patterns. Learning to express growth patterns algebraically is an important part of students’ mathematical development (Wilkie & Clarke, 2016), but the digital technology were a hindrance to this. In these tasks, students became button pushers when following the teacher’s suggestions to use regression in GeoGebra. As a result, they missed the opportunity to practice the curricular goal of expressing situations with formulas, unlike the students who chose to use pen and paper.
Regression is not a curricular goal in any
mathematics course in Norway, and it appears to have been introduced simply to
give the students a way to solve pattern generalization tasks. As many students
struggle to find a direct formula for the number of tiles in pattern ![]() ,
this will certainly help some students answer the tasks. However, easier than
finding the direct formula is finding the recursive formula (Wilkie & Clarke, 2016), expressing how
many tiles there are in pattern
,
this will certainly help some students answer the tasks. However, easier than
finding the direct formula is finding the recursive formula (Wilkie & Clarke, 2016), expressing how
many tiles there are in pattern ![]() using
the number of tiles in pattern
using
the number of tiles in pattern ![]() . Using
the recursive formula, students can find solutions to most given problems using
spreadsheets, by dragging the fill handle, or with programming, by writing a
loop. These techniques enable students who cannot yet find the direct formula
to access the tasks while also expressing the growth pattern.
. Using
the recursive formula, students can find solutions to most given problems using
spreadsheets, by dragging the fill handle, or with programming, by writing a
loop. These techniques enable students who cannot yet find the direct formula
to access the tasks while also expressing the growth pattern.
These methods might be a steppingstone for students in motivating and understanding the direct formula. As a teacher is cited by Kilhamn (2022, p. 5): “Then I showed the class how to modify this code so that instead of asking for a certain figure it prints the first 50 figures with the number of sticks in. And then you can see that: ‘Well there are 55 sticks in figure number 17’. And this–when they suddenly saw–they had it all there! It was like ‘wow’ they could do anything, all information was there in this table that was printed.” That is, students saw that the direct formula was useful because, with it, they could instruct the computer in a useful fashion. Hopefully, more students can experience a similar revelation rather than outsourcing the work of expressing the growth pattern to GeoGebra’s regression feature.
Limitations
The central limitation of our paper is that we do not have a random national sample, so the results should not be interpreted as unbiased estimates of teaching practices in Norway. We sampled schools to reflect variety in important demographic variables (see methods section), so our schools are different and many schools in Norway will resemble some school in our sample, but not in the correct proportion.
There are two limitations with regards to the identified functions of digital technology. First, we did not have a theoretical framework to guide this analysis, so when we in the discussion state that some functions are beneficial and other detrimental, this is based on our preconceived notions and not a theoretical model. (However, we are not aware of any fitting theoretical model of the functions digital tools have in inquiry, but see Ran et al., 2022). Second, we have identified the functions of digital technology during inquiry based on observations alone. This precludes us from finding many kinds of functions digital technology may have, such as emotional ones, for instance if digital technology makes mathematical inquiry more entertaining.
Another point of improvement is that we relied on two cameras in the classrooms. We mostly gained information about the students with a visible screen or students who spoke loudly about what they did or understood. This provides information about how some students in the class use and talk about digital technology during inquiry, but we do not know what prerequisites the students have and what academic strengths/challenges they have. We assume it is easier for academically strong students to participate in mathematical inquiry compared to students who find mathematics difficult or boring. In further research, it would be interesting to have more information about the individual students so that we can use individual characteristics to understand how they use digital technology during mathematical inquiry, possibly also adding other data sources such as screen-capture of the students’ computers. This must of course be done in line with ethical guidelines for research.
Concluding remarks
We found that 13 % of fifteen-minute segments in our sample used digital technology for mathematical inquiry, and mathematical inquiry was more common in segments with advanced use of digital technology. Graphing calculators and spreadsheets were most often used for inquiry. Digital technology enabled inquiry by efficiently drawing graphs, but at other times shifted the focus of the inquiry away from the mathematical points towards computational approaches and use of software features. Also, digital technology improved the efficiency of the consolidation phase. These findings should caution against overly simplistic views of the impact of digital technology on mathematics education.
References
Aashamar, P. N., Bakken, J., & Brevik, L. M. (2021). Fri fra lærebokas tøyler: Om bruk av læreboka og andre tekster i norsk, engelsk og samfunnsfag på 9. og 10. Trinn. Norsk Pedagogisk Tidsskrift, 105(3), 296–311. https://doi.org/10.18261/issn.1504-2987-2021-03-04
Artigue, M., & Blomhøj, M. (2013). Conceptualizing inquiry-based education in mathematics. ZDM, 45(6), 797–810. https://doi.org/10.1007/s11858-013-0506-6
Blomhøj, M., Valero, P., & Häggström, J. (2009). The role of research in mathematics education reform work. NOMAD Nordic Studies in Mathematics Education, 14(3), Article 3. https://doi.org/10.7146/nomad.v14i3.148206
Braun, V., & and Clarke, V. (2021). One size fits all? What counts as quality practice in (reflexive) thematic analysis? Qualitative Research in Psychology, 18(3), 328–352. https://doi.org/10.1080/14780887.2020.1769238
Braun, V., & Clarke, V. (2006). Using thematic analysis in psychology. Qualitative Research in Psychology, 3(2), 77–101. https://doi.org/10.1191/1478088706qp063oa
Brevik, L. M., Gudmundsdottir, G. B., Aashamar, P. N., Barreng, R. L. S., Dodou, K., Doetjes, G., Hartvigsen, K. M., Hatlevik, O. E., Mathé, N. E. H., Roe, A., Siljan, H., Stovner, R. B., & Suhr, M. L. (2024). Å jobbe utforskende på vg1 og vg2. Den enkelte lærers undervisning har mer å si enn fagenes egenart (Rapport 3, EDUCATE). Institutt for lærerutdanning og skoleforskning, Universitetet i Oslo. https://doi.org/10.5281/ZENODO.10473082
Brevik, L. M., Gudmundsdottir, G. B., Doetjes, G., & Barreng, R. L. S. (2023). Å observere fagfornyelsen i klasserommet. Observasjonsprotokoller for livsmestring, utorsking og digital kompetanse (Rapport 1, EDUCATE). Institutt for lærerutdanning og skoleforskning, Universitetet i Oslo. https://www.uv.uio.no/ils/forskning/prosjekter/educate/rapporter/educate-rapport-1-2023.pdf
Cevikbas, M., Greefrath, G., & Siller, H.-S. (2023). Advantages and challenges of using digital technologies in mathematical modelling education – a descriptive systematic literature review. Frontiers in Education, 8. https://doi.org/10.3389/feduc.2023.1142556
Dorier, J.-L., & Maass, K. (2014). Inquiry-Based Mathematics Education. In S. Lerman (Ed.), Encyclopedia of Mathematics Education (pp. 300–304). Springer Netherlands. https://doi.org/10.1007/978-94-007-4978-8_176
Drijvers, P. (2015). Digital Technology in Mathematics Education: Why It Works (Or Doesn’t). In S. J. Cho (Ed.), Selected Regular Lectures from the 12th International Congress on Mathematical Education (pp. 135–151). Springer International Publishing. https://doi.org/10.1007/978-3-319-17187-6_8
Drijvers, P., & Sinclair, N. (2024). The role of digital technologies in mathematics education: Purposes and perspectives. ZDM – Mathematics Education, 56(2), 239–248. https://doi.org/10.1007/s11858-023-01535-x
Erstad, O., Kjällander, S., & Järvelä, S. (2021). Facing the challenges of ‘digital competence.’ Nordic Journal of Digital Literacy, 16(2), 77–87. https://doi.org/10.18261/issn.1891-943x-2021-02-04
Fryer, T. (2022). A critical realist approach to thematic analysis: Producing causal explanations. Journal of Critical Realism, 21(4), 365–384. https://doi.org/10.1080/14767430.2022.2076776
Greefrath, G., Hertleif, C., & Siller, H.-S. (2018). Mathematical modelling with digital tools—A quantitative study on mathematising with dynamic geometry software. ZDM, 50(1), 233–244. https://doi.org/10.1007/s11858-018-0924-6
Gudmundsdottir, G. B., Brevik, L. M., Aashamar, P. N., Barreng, R. L. S., Dodou, K., Doetjes, G., Hartvigsen, K. M., Hatlevik, O. E., Isaksen, A. R., Magnusson, C. G., Mathé, N. E. H., Roe, A., & Skarpaas, K. G. (2024). Å gi rom for variasjon og valgfrihet, mens vi venter på digital dømmekraft (Rapport 4, EDUCATE). Institutt for lærerutdanning og skoleforskning, Universitetet i Oslo.
Heid, M. K. (1988). Resequencing Skills and Concepts in Applied Calculus Using the Computer as a Tool. Journal for Research in Mathematics Education, 19(1), 3–25. https://doi.org/10.2307/749108
Hillmayr, D., Ziernwald, L., Reinhold, F., Hofer, S. I., & Reiss, K. M. (2020). The potential of digital tools to enhance mathematics and science learning in secondary schools: A context-specific meta-analysis. Computers & Education, 153, 103897. https://doi.org/10.1016/j.compedu.2020.103897
Isaksen, R. (2024). Exploring learning in critical realism. In D. Scott (Ed.), On Learning (vol. 2): Philosophy, concepts and practices (pp. 97-126). UCL Press.
Karseth, B., Kvamme, O. A., & Ottesen, E. (2020). Fagfornyelsens læreplanverk: Politiske intensjoner, arbeidsprosesser og innhold (Rapport 1, EVA2020). Det utdanningsvitenskapelige fakultet, Universitetet i Oslo. https://www.uv.uio.no/om/aktuelt/aktuelle-saker/fakultet/2020/eva2020--delrapport---ap1-05102020.pdf
Kilhamn, C. (2022, February). Tinkering in algebra—The case of John [Conference presentation]. Twelfth Congress of the European Society for Research in Mathematics Education (CERME12), TWG03(08). Bozen-Bolzano, Italy.
Klette, K., Blikstad-Balas, M., & Roe, A. (2017). Linking instruction and student achievement. A research design for a new generation of classroom studies. Acta Didactica Norge, 11(3). https://doi.org/10.5617/adno.4729
Kure, A. E., Blikstad-Balas, M., & Brevik, L. M. (2025). Digital ambitions vs. classroom reality in Norwegian lower secondary schools: What digital competencies are students developing over time? Teaching and Teacher Education, 153. https://doi.org/10.1016/j.tate.2024.104843
Kure, A. E., Brevik, L. M., & Blikstad-Balas, M. (2023). Digital skills critical for education: Video analysis of students’ technology use in Norwegian secondary English classrooms. Journal of Computer Assisted Learning, 39(1), 269–285. https://doi.org/10.1111/jcal.12745
Leer, L. G., & Stengrundet, S. (2023, April). Geogebra og Kjernelementene. Matematikksenteret.
Munthe, E., Erstad, O., Njå, M. B., Forsström, S. E., Gilje, Ø., Amdam, S., Moltudal, S., & Hagen, S. B. (2022). Digitalisering i grunnopplæring; kunnskap, trender og framtidig kunnskapsbehov. Kunnskapssenter for utdanning. Universitetet i Stavanger.
National Committee for Research Ethics in the Social Sciences and the Humanities. (2021). Guidelines for Research Ethics in the Social Sciences and the Humanities. National Committee for Research Ethics in the Social Sciences and the Humanities. https://www.forskningsetikk.no/globalassets/dokumenter/4-publikasjoner-som-pdf/nesh-guidelines-en-2024/
Pedaste, M., Mäeots, M., Siiman, L. A., de Jong, T., van Riesen, S. A. N., Kamp, E. T., Manoli, C. C., Zacharia, Z. C., & Tsourlidaki, E. (2015). Phases of inquiry-based learning: Definitions and the inquiry cycle. Educational Research Review, 14, 47–61. https://doi.org/10.1016/j.edurev.2015.02.003
Ran, H., Kim, N. J., & Secada, W. G. (2022). A meta-analysis on the effects of technology’s functions and roles on students’ mathematics achievement in K-12 classrooms. Journal of Computer Assisted Learning, 38(1), 258–284. https://doi.org/10.1111/jcal.12611
Rohatgi, A., Hatlevik, O. E., Gudmundsdottir, G. B., Erstad, O. A., & Björnsson, J. K. (2024). ICILS 2023: Digital kompetanse og algoritmisk tenkning hos norske niendeklassinger. Cappelen Damm Akademisk/NOASP. https://doi.org/10.23865/noasp.219
Skarpaas, K. G., & Dodou, K. (in process). Digital responsibility in the English subject. Submitted.
Stengrundet, S. (2019, January). Resonnering med GeoGebra. Matematikksenteret og Naturfagsenteret.
Stovner, R. B., Hatlevik, O. E., Aashamar, P. N., Brevik, L. M., Gudmundsdottir, G. B., & Lid, G. (2025). Å arbeide algoritmisk i matematikk: Algoritmisk tenkning og programmering på 8. Trinn, 10. Trinn og VG1 (Rapport 5, EDUCATE). Institutt for lærerutdanning og skoleforskning, Universitetet i Oslo. https://www.uv.uio.no/ils/forskning/prosjekter/educate/rapporter/stovner-et-al-(2025)-educate-rapport-5.pdf
Timotheou, S., Miliou, O., Dimitriadis, Y., Sobrino, S. V., Giannoutsou, N., Cachia, R., Monés, A. M., & Ioannou, A. (2023). Impacts of digital technologies on education and factors influencing schools’ digital capacity and transformation: A literature review. Education and Information Technologies, 28(6), 6695–6726. https://doi.org/10.1007/s10639-022-11431-8
Trgalová, J., & Tabach, M. (2023). Introduction to How Digital Resources Transform Content. In B. Pepin, G. Gueudet, & J. Choppin (Eds.), Handbook of Digital Resources in Mathematics Education (pp. 1–9). Springer. https://doi.org/10.1007/978-3-030-95060-6_11-1
Trouche, L. (2004). Managing the Complexity of Human/Machine Interactions in Computerized Learning Environments: Guiding Students’ Command Process through Instrumental Orchestrations. International Journal of Computers for Mathematical Learning, 9(3), 281–307. https://doi.org/10.1007/s10758-004-3468-5
Weigand, H.-G., Trgalova, J., & Tabach, M. (2024). Mathematics teaching, learning, and assessment in the digital age. ZDM – Mathematics Education, 56(4), 525–541. https://doi.org/10.1007/s11858-024-01612-9
Wilkie, K. J., & Clarke, D. M. (2016). Developing students’ functional thinking in algebra through different visualisations of a growing pattern’s structure. Mathematics Education Research Journal, 28(2), 223–243. https://doi.org/10.1007/s13394-015-0146-y
Young, J. (2017). Technology-enhanced mathematics instruction: A second-order meta-analysis of 30 years of research. Educational Research Review, 22, 19–33. https://doi.org/10.1016/j.edurev.2017.07.001
Zhang, Y., Wang, P., Jia, W, Zhang, A., & Chen, G. (2025). Dynamic visualization by GeoGebra for mathematics learning: A meta-analysis of 20 years of research. Journal of Research on Technology in Education, 57(2), 437–458. https://doi.org/10.1080/15391523.2023.2250886
![]() ©2025
Roar B. Stovner, Ole E. Hatlevik. This is an Open Access article distributed under
the terms of the Creative Commons Attribution 4.0 International License
(http://creativecommons.org/licenses/by/4.0/), allowing third parties to copy
and redistribute the material in any medium or format and to remix, transform,
and build upon the material for any purpose, even commercially, provided the
original work is properly cited and states its license.
©2025
Roar B. Stovner, Ole E. Hatlevik. This is an Open Access article distributed under
the terms of the Creative Commons Attribution 4.0 International License
(http://creativecommons.org/licenses/by/4.0/), allowing third parties to copy
and redistribute the material in any medium or format and to remix, transform,
and build upon the material for any purpose, even commercially, provided the
original work is properly cited and states its license.