![]()
Mari Lande With
Are Teachers Increasingly Leaving the Profession?
Abstract: Changes in teachers’ work, often labelled intensification, have raised concerns that teachers are leaving the profession at an increasing rate. The present paper uses high-quality data from Norwegian administrative registers to examine the trends in attrition across three decades. These data allow for a comprehensive examination of changes in attrition, taking teachers’ education, school level, and demographic characteristics into account. Results show that early career attrition has declined over time, whereas the incidence of early retirement increased.
Keywords: Teachers; PGCE; attrition; change; retention
In recent decades, changes in teachers’ work have raised concerns that teachers are leaving the profession at an increasing rate. Low pay, decline in public respect, increased workload, and declining autonomy are all factors that have been identified as potential triggers of teacher turnover (Skaalvik & Skaalvik, 2011; Smethem, 2007; Webb et al., 2004). Nevertheless, despite widespread concerns for teacher attrition, there is limited empirical evidence of an increasing trend.
Moreover, developments in the labour market during the past decades may have improved the scope for teacher retention. As increasing shares of the population hold higher education degrees, the transferability of teaching credentials to non-teaching positions may have declined. This paper examines the relative importance of such trends for changes in teacher attrition in Norway across more than three decades. The study uses high-quality data from administrative registers, allowing a more thorough examination of trends than data used in previous research. The Norwegian case is interesting because of Norway’s generally low levels of unemployment and its strong economy, which, as noted by the OECD (2005), often creates particular difficulties in recruiting and retaining teachers. Despite variations between countries, concerns about the impact of heavy workloads and low rewards on teacher retention are widespread (Ingersoll, Merrill, & Stuckey, 2014; Lindqvist, Nordanger, & Carlsson, 2014; OECD, 2005; Webb et al., 2004). The generalizability of findings will be further discussed in the concluding section of this paper.
Background
Internationally, several widely cited studies have reported high levels of teacher attrition, particularly in the first few years after graduation. For instance, in the United States, researchers have estimated that 40% to 50% of new teachers leave within the first five years (Ingersoll et al., 2014; Stinebrickner, 1998). In the United Kingdom, Purcell, Wilton, Davies, and Elias (2005) found that between 25% and 35% of qualified teachers were employed outside teaching after seven years.
Despite the quite extensive research into factors associated with teacher attrition, few studies have systematically examined attrition patterns over time, the most important reason being the lack of appropriate data available. One exception is a study by Grissmer and Kirby (1992), who examined attrition from teaching in Indiana between 1965 and 1987. According to their study, attrition decreased over time. The pattern was largely explained by demographic changes, such as the age composition of the teacher workforce and female labour market participation. Several less comprehensive studies of attrition show varying patterns. In the UK, Smithers and Robinson (2005) found an increase in annual attrition rates between the mid-1990s and 2001; however, the trend did not continue in subsequent years. Luekens, Lyter, and Fox (2004) and Ingersoll et al. (2014) found an increase in attrition among US teachers since the 1990s. In Norway, Arnesen (2002) found that attrition declined among early-career teachers in the 1990s.
A limitation of previous studies is that teachers returning to the profession are not accounted for, even though there is evidence that teachers who leave often return to teaching (Grissmer & Kirby, 1992; Lindqvist et al., 2014). Furthermore, most of the studies cited above do not control for demographic changes in the teacher population. If, on the one hand, increasing attrition rates are caused by changes in the demographic composition of the teaching force—for instance, in terms of teachers’ age or gender—such trends may be difficult to combat. If, on the other hand, attrition increases among teachers with similar experience, age, and other characteristics, this is of particular policy interest. Examining variations in attrition patterns across different teacher groups is also relevant for deciding how such trends should be explained. An important contribution of this paper is that both characteristics of teachers and changes across the teaching career are taken into account.
Concepts and delimitation of the study
Typically, research on attrition distinguishes between teachers moving from one teaching position to another and teachers leaving the profession altogether. This study is primarily concerned with teachers leaving the profession. Furthermore, the analyses distinguish between cohort attrition, which refers to the total proportion of graduation cohorts from teacher education who leave the profession, and annual attrition, which refers to the proportion of teachers who are employed in schools one year and who leave in the subsequent year. Because the mechanisms leading to teachers “being ‘lured’ away … by the attractiveness of non-teaching jobs” and those causing teachers to leave employment altogether are likely to differ (Stinebrickner, 2002, pp. 211-212), a further distinction is made between attrition to non-school employment and attrition to non-employment.
The data analysed in this paper do not include teachers’ motives for leaving. However, the tenure rates in teaching are generally high, and regulations concerning terminations are strict. This indicates that attrition from teaching is predominantly voluntary. Nonetheless, the possibility that lower demand has affected attrition is discussed in relation to the results.
The Norwegian school system and teacher education
Norwegian pupils spend ten years in compulsory education, starting at age 6. Compulsory schooling is divided between the primary level (grades 1-7) and the lower secondary level (grades 8-10). Moreover, enrolment in either three-year academic or four-year vocational upper secondary programs is nearly universal. A large majority of schools are public.
Various teacher education programs qualify for work in primary and secondary education. The two largest programs are the general teacher education (GTE), a four-year bachelor’s level degree that qualifies individuals for teaching in primary and lower secondary education, and the postgraduate certificate in education (PGCE), currently a one-year course for graduates from higher education that qualifies for teaching fifth through 13th grade. With some additional training, both teacher groups may teach all grades. Whereas most teachers at the primary level have GTE, about 80% of teachers in academic upper secondary programs hold a PGCE (Caspersen, Aamodt, Vibe, & Carlsten, 2014; Turmo & Aamodt, 2009). Although teachers with GTE represent a majority at the lower secondary level, PGCE teachers also make up a substantial share of teachers at this level.
Theoretical perspectives
A basic assumption underlying research on teacher attrition is that individuals will remain in the profession if teaching represents the most attractive activity to pursue among available alternatives (Guarino, Santibanez, & Daley, 2006). Studying to become a teacher can be seen as an investment in human capital (Becker, 1993). According to human capital theories, actors invest in education based on available information on rewards, costs, and risks associated with this education. Teacher education may also be a way of accumulating human capital that is of value in other careers (Grissmer & Kirby, 1992). In this sense, attrition may be a planned course of action. This may vary among teachers, depending on how much they have invested in their teacher education (Harris & Adams, 2007).
However, desire is not sufficient to produce a given outcome. In order for this preference to affect a persons’ actions one must also have the opportunity to do as one wishes (Hedström, 2005). Accordingly, the levels of teacher attrition are dependent on the availability of work that is perceived as more rewarding outside the teaching profession, as well as the transferability of teachers’ accumulated human capital to other types of employment (Harris & Adams, 2007).
Although human capital theories often focus on economic incentives, the idea that individuals maximize available rewards can be extended to include other types of rewards (Becker, 1993). The literature on teacher motivation typically distinguishes between extrinsic and intrinsic rewards (Watt et al., 2012). Teachers motivated by intrinsic rewards are attracted by the inherent satisfaction of teaching. By contrast, extrinsic motivation is induced by rewards that are external to the teaching activity itself, such as pay and job security.
Previous research on causes of teacher attrition
In line with the predictions of the human capital theory, previous studies indicate that a fairly high proportion of PGCE graduates do not plan to stay in the profession, or see teaching as a fallback career (Kyriacou & Kunc, 2007; Turmo & Aamodt, 2009; Watt et al., 2012). Research also shows that attrition is higher among teachers with a PGCE than among teachers with more specialized teacher education (Guarino et al., 2006; Purcell et al., 2005). Furthermore, teachers with credentials that are more sought after in the labour market, such a master’s degree or a degree in science, are more likely to leave (Borman & Dowling, 2008; Chevalier, Dolton, & McIntosh, 2007; Mastekaasa, 2011).
Although a fairly consistent finding is that higher teacher salaries correlate with lower attrition (Borman & Dowling, 2008; Guarino et al., 2006; Schøne, 1999), research on motivation typically finds that teachers emphasize intrinsic and social aspects of work as motivation for both entering and remaining in the profession (Guarino et al., 2006; Roness & Smith, 2009). Among the highest-rated motives are the enjoyment of working with youth and contributing to society. Workload, government initiatives, lack of administrative and colleague support, and discipline problems have been found to influence teachers’ turnover intentions (Lindqvist et al., 2014; Skaalvik & Skaalvik, 2011; Smethem, 2007; Webb et al., 2004). Such factors are also cited as important reasons for leaving among individuals who have left teaching (Purcell et al., 2005; Struyven & Vanthournout, 2014).
Attrition, age, and career stage
Attrition from teaching is typically highest among recent graduates and teachers approaching retirement (Grissmer & Kirby, 1992; Guarino et al., 2006). Whereas younger teachers more often leave for other types of employment, older teachers retire from the labour market altogether. Factors contributing to teacher attrition vary among teachers in different career stages. Previous research indicates that salary and availability of permanent employment opportunities are more important for younger teachers, whereas workload has a particularly negative impact on retention among experienced teachers (OECD, 2005; Van Droogenbroeck & Spruyt, 2014). Moreover, experienced teachers are often more negative toward educational change (Hargreaves, 2005; Maskit, 2011; Mausethagen, 2013a). Distinguishing between early-, mid-, and late-career teachers, Hargreaves (2005) suggested that early-career teachers experience “change as part of life” (p. 972-973), whereas late-career teachers often experience decreasing energy and are tired of “successive changes passing through their school” (p. 975). Nevertheless, workload is also associated with attrition among early-career teachers. In this group, attrition is frequently attributed to insufficient preparation combined with high demands (Smethem, 2007).
Changes in teachers’ work
During the past few decades, teachers in many countries have faced new demands and challenges (Ballet & Kelchtermans, 2009; Webb et al., 2004). According to the “thesis of intensification,” managerial ideologies and an increased focus on the outcomes of education have resulted in a restructuring of teachers work (Apple, 1986). Several studies have linked such changes to teacher discontent and motivation to leave teaching. In recent years, intensification has been linked to accountability policies and an increase in teachers’ workload owing to curriculum planning, student assessment, and test preparation (Ballet & Kelchtermans, 2009; Smethem, 2007; Webb et al., 2004).
In Norway, political control of the school sector has increased since the 1990s, as exemplified by the 1997 introduction of a national instructional curriculum (Imsen & Volckmar, 2014). The PISA survey in 2000 showed Norwegian students performing at or below the average of other OECD countries and played a central role in legitimizing accountability policies (Hatch, 2013; Mausethagen, 2013a). A national quality assessment system was introduced in 2004, which included instruments to evaluate pupil performance and progress, enabling principals and school owners to hold teachers accountable for results (Hatch, 2013; Tveit, 2014). Although these policies have relatively limited consequences for teachers compared with policies in many other countries (Hatch, 2013), demands for documentation and systematic evaluation of pupils have increased teacher workload (Norwegian Ministry of Education and Research, 2009).
Prior to the 2004 reform, there was no grading or other summative evaluation of pupils’ performance at the primary school level. Thus, these policies represented a larger shift in the routines of teachers in lower school levels. Skaalvik and Skaalvik (2011) found that increased time pressure experienced by Norwegian primary and lower secondary teachers contributed to emotional exhaustion and motivation to leave the profession. However, Mausethagen (2013a) found that many Norwegian teachers accept new accountability measures, although some elements are negotiated and resisted by teachers. Early-career teachers were found to be more accepting, whereas “veterans” more often see these policies as a threat to teacher autonomy. Although recent educational changes are often perceived as limiting teachers’ autonomy, there are also signs that teaching has become more collaborative (Hargreaves, 1994; Mausethagen, 2013b). Policies that have increased demands for teachers’ presence at schools outside teaching hours may contribute to more teacher collaboration. This may improve retention, particularly among early-career teachers, for whom support from administration and colleagues has been found to be particularly important (Pomaki, DeLongis, Frey, Short, & Woehrle, 2010). In sum, these studies indicate that if policy changes have led to increased teacher attrition, this should be particularly traceable among teachers in lower school levels, which is where reforms have had the greatest impact, and particularly among late-career teachers, who are most resisting towards change.
Accountability policies are quite recent in the Norwegian context. Furthermore, several other developments may have affected attrition in the period covered in this study. For instance, from the 1970s to mid-1980s teacher earnings declined compared with earnings in many other occupations, particularly for teachers with qualifications at the master’s level (Aanensen, 2010; Høgsnes, 2000). In addition, a number of scholars have described a decrease in the social esteem of teachers (Høgsnes, 2000; Rovde, 2004). The negative media attention in the aftermath of PISA was associated with a decline in the public perception of teaching (Fladmoe & Leiulfsrud, 2013). According to Skaalvik and Skaalvik (2010), teachers experience low status and negative media attention as stressful.
Opportunities for leaving the profession
As outlined above, attrition depends on teachers having both the motivation and the opportunity to leave. In Norway, higher education expanded greatly between the 1960s and 1990s. Consequently, the competition for positions requiring such qualifications may have increased. Although unemployment levels have been generally low, Barone and Ortiz (2011) found the prevalence of overeducation is higher than in many other European countries. The transition from university to employment in Norway has become more difficult since the 1990s, particularly for social science and humanities graduates (Opheim, 2004; Støren, 2014). By contrast, graduates from teacher education are rarely unemployed or in non-relevant employment (Opheim, 2004). These patterns suggest that school employment may be increasingly attractive and that the transferability of teacher human capital to non-teaching employment may have declined. Throughout the period under study, teachers—and other public servants—have enjoyed a relatively high level of job-security and a predictable pay schedule based on length of service.
Whereas attrition to non-school employment is affected by labour market opportunities, attrition to non-employment is contingent on retirement regulations. In Norway, the ordinary retirement age is 67 years. Teachers are also eligible for early retirement pension. The eligibility age for early retirement was reduced in the 1990s; from 65 years to 63 years in 1997, and subsequently to 62 in 1998 (Snartland & Øverbye, 2003). Individuals with physical or psychological illness may also qualify for a disability pension. Because benefits generally are lower than teacher earnings, retirement implies incurring a financial penalty.
Data and analytical strategy
The data analysed in this paper were derived from administrative registers supplied by Statistics Norway. The data include detailed records on education for all Norwegian residents since 1975 and information on the highest level of education completed before 1975. Data on income and employment, reported by employers and tax authorities, were available for the years 1992 to 2008. The teachers included in the analyses hold either GTE, or a PGCE combined with a bachelor’s or master’s degree in humanities, social science, or science (including mathematics). Individuals without formal teacher credentials, PGCE teachers with other professional degrees and other types of teacher education are excluded. The selected groups constitute about 60% of all teachers.
The analyses were carried out in three stages. First, changes in attrition were examined comparing cohorts who graduated from teacher education at different time points (“cohort analysis”). Separate analyses were conducted for GTE graduates, bachelor’s level PGCE graduates, and master’s level PGCE graduates, which represent teachers with different levels of investment and transferability of skills. The analyses included all teachers under 60 years old who graduated from the selected teacher education programs between 1975 and 2003. Owing to greater variations in early- and late-career stages, only data on employment activity between five and 20 years after graduation were used in these models (N = 57 025) 1 .
The second and third stages addressed annual attrition to other types of employment (“employment-exit”) and to non-employment (“retirement-exit”). Whereas the cohort analyses compared groups with different types of teacher education, the analyses of annual attrition compared teachers employed at different school levels, based on the assumption that working conditions have changed more in lower school levels. These analyses included all GTE and PGCE graduates with a degree in humanities, social science, or science from 1951 through 2007 who were employed in primary or secondary education at some point between 1992 and 2008 (N = 97 415). Because data on education are less detailed before 1975, the PGCE category also included teachers who completed a degree in the cited disciplines before 1975, without a registered PGCE. This group constituted nearly 90% of the teachers with a degree in these fields who graduated before 1975. It was assumed that most of these teachers hold a PGCE but that this information was missing in the database. According to the Norwegian Ministry of Education (1999), university graduates without teaching credentials comprised only 3% to 5% of teachers in the 1990s. Further analyses indicated that these teachers differed little from other PGCE graduates in terms of attrition (not shown).
Variables
Three dependent variables were defined. In the cohort analyses, the dependent variable distinguished between individuals who were employed in the school sector and those who were not (non-teacher = 1, teacher = 0). 2 Here, school employment included all employment in primary and secondary schools as well as special education and other types of education but excluded higher education. 3
In the employment-exit models, the dependent variable distinguished between teachers who were employed in the same school level as the previous year and those who had left. Thus, for individuals identified as primary or lower secondary teachers in a specific year, the variable had the value of 1 if the teacher left this school level for any other teaching or non-teaching position by the next year. Similarly, it had the value of 1 if a teacher left upper secondary education for any other position. Consequently, in these analyses, attrition included teachers leaving to teach at a different school level, in order to examine whether changing working conditions in lower levels of schooling increasingly drove teachers away from this type of employment. Further analyses showed that among primary/lower secondary teachers who left, 60% left teaching altogether, while 40% remained in some type of education employment. Among upper secondary teachers, approximately 50% left teaching altogether.
In the retirement-exit analyses, the dependent variable identified attrition to non-employment (all employment = 0). Individuals with very low annual income (<60 000 2011 NOK) were defined as not employed. 4
School level was also included as an independent variable, referring to the school of employment in the previous year. This variable had two categories: primary/lower secondary and upper secondary. 5
In the cohort analysis, change over time was examined by comparing graduation cohorts (year of completion of teacher education), grouped in five-year intervals (except for the last interval, which includes graduates between 2000 and 2003). Moreover, two spline variables (5–10 years, 11–20 years) were included to model the relationship between time since graduation and attrition as two linear segments (because attrition increases more early in the career). To allow for variations across cohorts, further analyses with interactions between cohort and time since graduation were conducted, but as they yielded very similar results, the simpler models were preferred.
In the employment-exit and retirement-exit analyses, the change was examined comparing attrition in different periods (1992–1997, 1998–2002, and 2003–2007), referring to the year of employment.
In the employment-exit models, time since graduation was used as a proxy for teaching experience. Separate analyses were conducted for teachers in different career stages, corresponding to Hargreaves’s (2005) categories of early-career (<=five years), mid-career (6-20 years), and late-career teachers (>20 years).
Because exits from the labour market are closely related to age, the retirement-exit analyses focused on age rather than experience. The relationship between age and attrition is highly nonlinear. Therefore, age was measured by an age group variable, distinguishing between teachers 40 years or younger, 41 to 50 years, 51 to 60 years, and with each age between 61 and 66 years constituting a separate category. Teachers aged 67 years (ordinary retirement age) or older were excluded from the analyses.
Control variables included dummies for centrality of place of residence (five categories); enrollment in further education; completion of a master’s degree; gender 6 ; age at graduation; dummies for children under 1, 4, and 8 years old; and interactions of children and gender, and for PGCE graduates, field of study. Table 1 shows descriptive statistics for teachers by type of education and time of graduation. In supplementary analyses, a more detailed subject of study variable and higher education grade-point average (GPA) were included for PGCE graduates (not shown) 7 .
Table 1
Descriptive statistics for graduates for general teacher education (GTE) and postgraduate teacher education (PGCE), by graduation cohort
|
|
|
<1975 |
1975-1979 |
1980-1984 |
1985-1989 |
1990-1994 |
1995-1999 |
2000-2003 |
2004-2007 |
Total |
|---|---|---|---|---|---|---|---|---|---|---|
|
GTE graduates |
||||||||||
|
Female |
% |
63 |
60 |
67 |
73 |
75 |
68 |
72 |
75 |
68 |
|
Age at grad. |
Mean |
- |
26 |
27 |
27 |
28 |
27 |
28 |
30 |
27 |
|
N |
20739 |
8273 |
7685 |
4605 |
6038 |
7668 |
7377 |
7637 |
70022 |
|
|
PGCE graduates |
||||||||||
|
Female |
% |
33 |
37 |
44 |
54 |
57 |
65 |
65 |
62 |
49 |
|
Age at grad. |
Mean |
- |
29 |
30 |
32 |
32 |
30 |
33 |
33 |
30 |
|
Master’s degree |
% |
39 |
35 |
35 |
24 |
24 |
27 |
30 |
35 |
32 |
|
Field of study |
||||||||||
|
Humanities |
% |
52 |
60 |
64 |
60 |
53 |
64 |
63 |
58 |
58 |
|
Social sci. |
% |
18 |
12 |
12 |
21 |
25 |
22 |
22 |
25 |
19 |
|
Science |
% |
30 |
28 |
24 |
19 |
22 |
14 |
14 |
16 |
23 |
|
Total |
% |
100 |
100 |
100 |
100 |
100 |
100 |
100 |
100 |
100 |
|
N University, no PGCE |
5746 |
5746 |
||||||||
|
N PGCE |
760 |
3866 |
3425 |
1797 |
2904 |
2812 |
2602 |
3481 |
21647 |
|
|
N Total |
6506 |
3866 |
3425 |
1797 |
2904 |
2812 |
2602 |
3481 |
27393 |
|
|
N all teachers |
27245 |
12139 |
11110 |
6402 |
8942 |
10480 |
9979 |
11118 |
97415 |
|
Method
The data were analysed using Poisson regression (Zou, 2004). An important advantage of Poisson regression for dichotomous dependent variables is that it is more robust to issues associated with omitted covariates than logistic regression is (Gail, Wieand, & Piantadosi, 1984). Because the data included repeated observations for the same individuals, dependence across individuals over time was taken into account using cluster-robust standard errors. Results are presented in figures as predicted probabilities.
Results
Changes in cohort attrition
Figures 1 through 3 show the probability that graduates are not employed in the school sector, by graduation cohort. In all groups, results were predicted for a female who is 29 years old at graduation, has no children, has no further education, resides in a central municipality; and for PGCE graduates, a humanities degree holder. Full models are reported in Table A1 in the appendix. The predicted probabilities were calculated at five, 10, and 20 years after graduation. Because labour market data were available only from 1992 through 2008, not all cohorts were observed at each time point. Nonetheless, it was possible to examine cohorts at comparable stages of their careers. The first three cohorts were observed 20 years after graduation, cohorts graduating in the 1980s and 1990s were observed 10 years after graduation, and teachers graduating between the late 1980s and 2003 were observed five years after graduation.
Figure 1.
Predicted probability that bachelor’s graduates with postgraduate teacher education (PGCE) are not employed in the school sector, by graduation cohort at 5, 10, and 20 years after graduation. 95% CI error bars
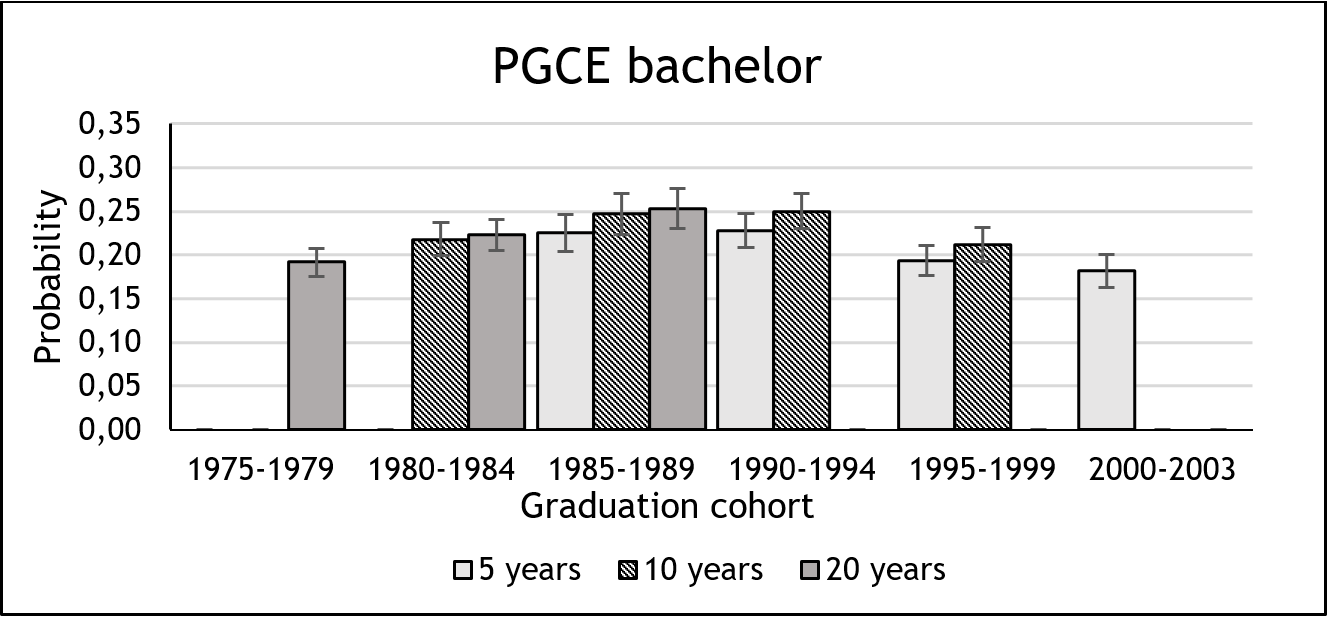
Figure 2.
Predicted probability that master’s graduates with postgraduate teacher education (PGCE) are not employed in the school sector, by graduation cohort, at 5, 10, and 20 years after graduation. 95% CI error bars
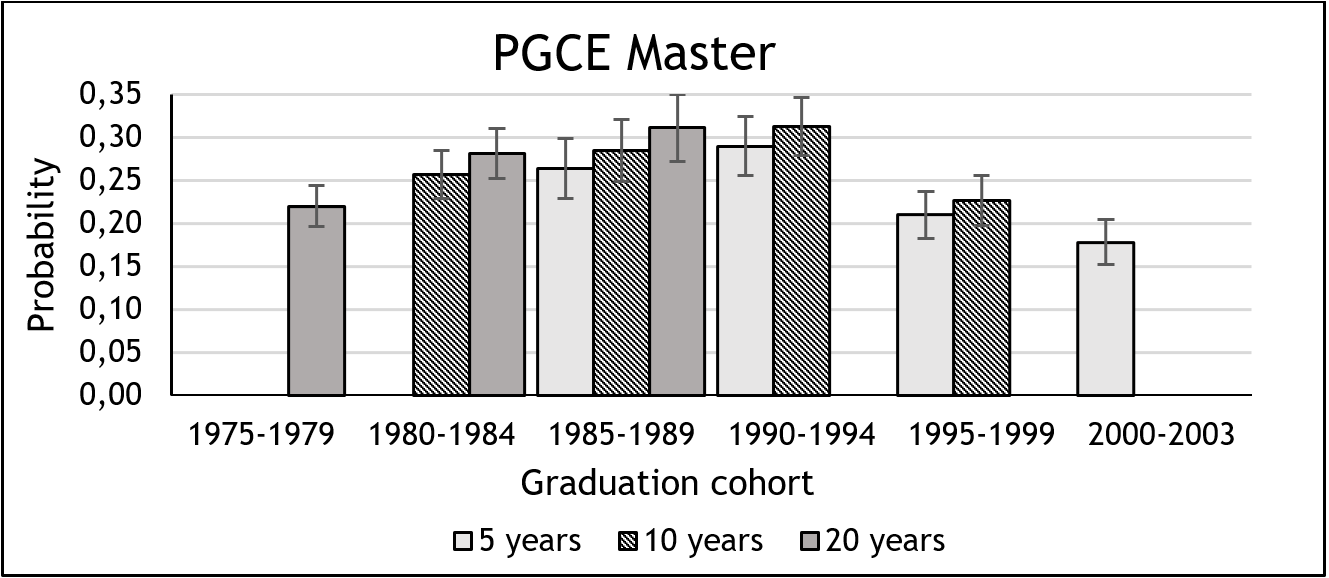
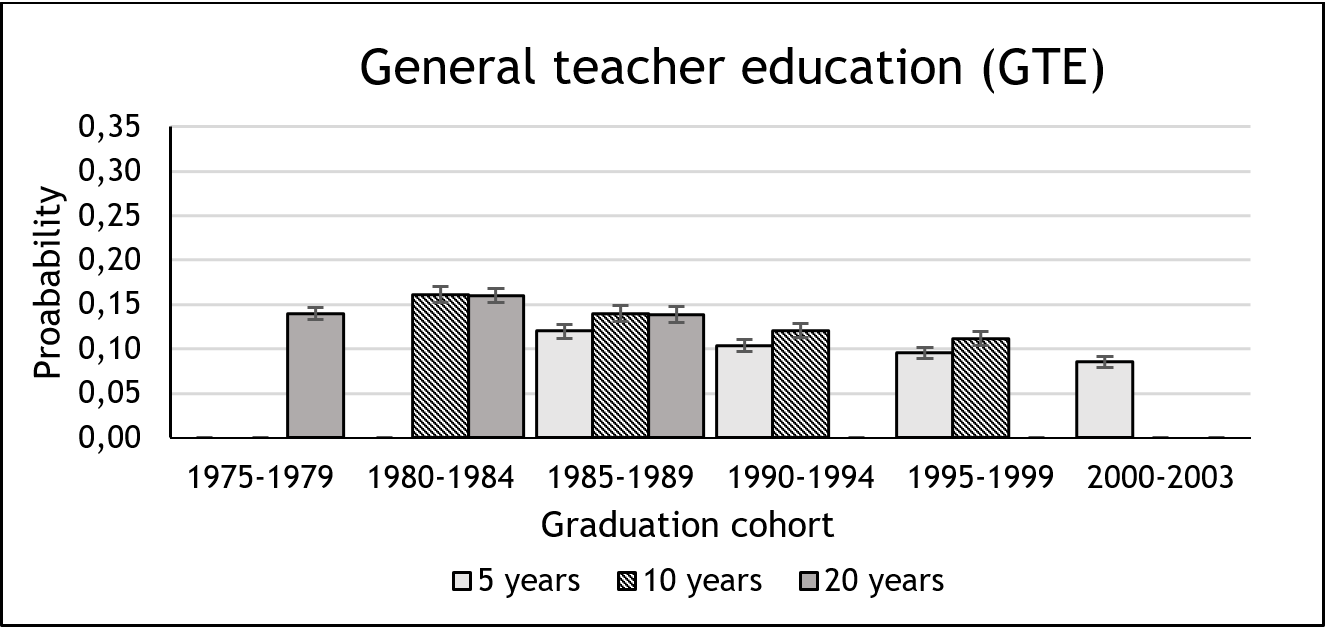
Figure 3.
Predicted probability that General teacher education (GTE) graduates are not employed in the school sector, by graduation cohort, at 5, 10, and 20 years after graduation. 95% CI error bars
Between 18% and 25% of PGCE graduates with qualifications at the bachelor’s level were not employed in the school sector (Figure 1). Of individuals who graduated between 1975 and 1979, 19% were not employed in the school sector 20 years later. In the 1980’s cohorts, the proportions outside teaching 20 years after graduation were somewhat higher (at 22% and 25%), whereas attrition is somewhat lower among PGCE bachelor’s degree-holders graduating between 1995 and 1999. In this cohort, 21% had left teaching within ten years, compared with 25% in the late 1980s/early 1990s. These differences across cohorts are statistically significant, although not very large.
Figure 2 shows a similar trend among PGCE graduates with qualifications at the master’s level: attrition increased significantly from the cohorts graduating in the late 1970s to the late 1980s and early 1990s cohorts. From the early to late 1990s, attrition levels declined (from 31% to 23%, measured 10 years after graduation).
Figure 3 shows results for GTE graduates. Attrition in this group is lower, with levels varying between 9% and 16%. Attrition increased somewhat from the 1970s to early 1980s cohorts, but subsequently, there was a steady trend toward lower attrition. Moreover, among GTE teachers, attrition appears to have been even lower in the 1990s than in the late 1970s, but some caution is necessary when comparing these cohorts, as they were not observed at the same career stages.
Generally, attrition was somewhat higher among master’s graduates than among bachelor’s graduates, and higher for teachers with a PGCE compared with teachers holding a GTE. This is in line with previous research and the predictions of human capital theories; teachers with credentials that are attractive in the labour market have a higher risk of leaving. However, in the most recent cohorts, there was no significant difference in attrition levels of bachelor and master’s graduates. Differences within cohorts between five and 20 years after graduation were generally small, supporting findings in previous research that most attrition occurs in early and late career stages.
The effects of control variables were in line with findings in previous research (see Table A1). Being male, holding a social science, science or master’s degree and residing in a central area are factors associated with a higher risk of leaving.
To examine how selection into teacher education affects attrition, the same analyses were conducted without control variables, and with a detailed subject of study variable and GPA (PGCE graduates only). These models yielded very similar results, suggesting that demographic variations or changes in selectivity of teacher education did not drive the results. The analyses with higher education GPA showed that the highest-performing PGCE graduates had a higher risk of leaving the teaching profession in all cohorts.
In summary, results from the cohort analyses showed no evidence of a trend toward higher teacher attrition. Although attrition was higher among graduates in the 1980s than among teachers graduating in the late 1970s, attrition declined in subsequent cohorts. These patterns may reflect a decreased transferability of teacher credentials. For PGCE graduates, there was a decline in attrition from the mid-1990s. In 1994, the PGCE course was extended from one to two semesters. One possible explanation for the observed change is that the extension affected selection into PGCE training programs and that graduates in subsequent years differed from peers in previous cohorts in terms of motivation. For instance, the increased investment costs may have reduced the appeal of this program among graduates who see teaching as a fallback career.
Attrition to other employment
The subsequent analyses examine whether attrition to other types of employment has increased. In the cohort models, no distinction was made between this and attrition to non-employment. Moreover, the attrition levels included teachers who may never have worked as teachers. Because working conditions likely are more important for individuals with teaching experience, the following analyses compare annual attrition rates for different time periods, for teachers in different career stages, and for teachers employed at different school levels.
As reduced demand in the non-school labour market may have led to lower overall attrition, particular interest is directed toward differences between teachers employed in school levels that were unequally affected by the recent educational reform. Here, teacher education is included as a control variable, thus comparing teachers with similar training in different school levels.
Figure 4.
Annual attrition rates, exits to other employment (employment-exits), by school level in a previous year, time period, and career stage. 95% CI error bars. Predicted for female, no children < 8, bachelor’s graduate in humanities with PGCE, no further education, residing in central municipality, aged 35 (1-5 years’ experience), 45 (6-20 years’ exp.) or 55 (>20 years’ exp.
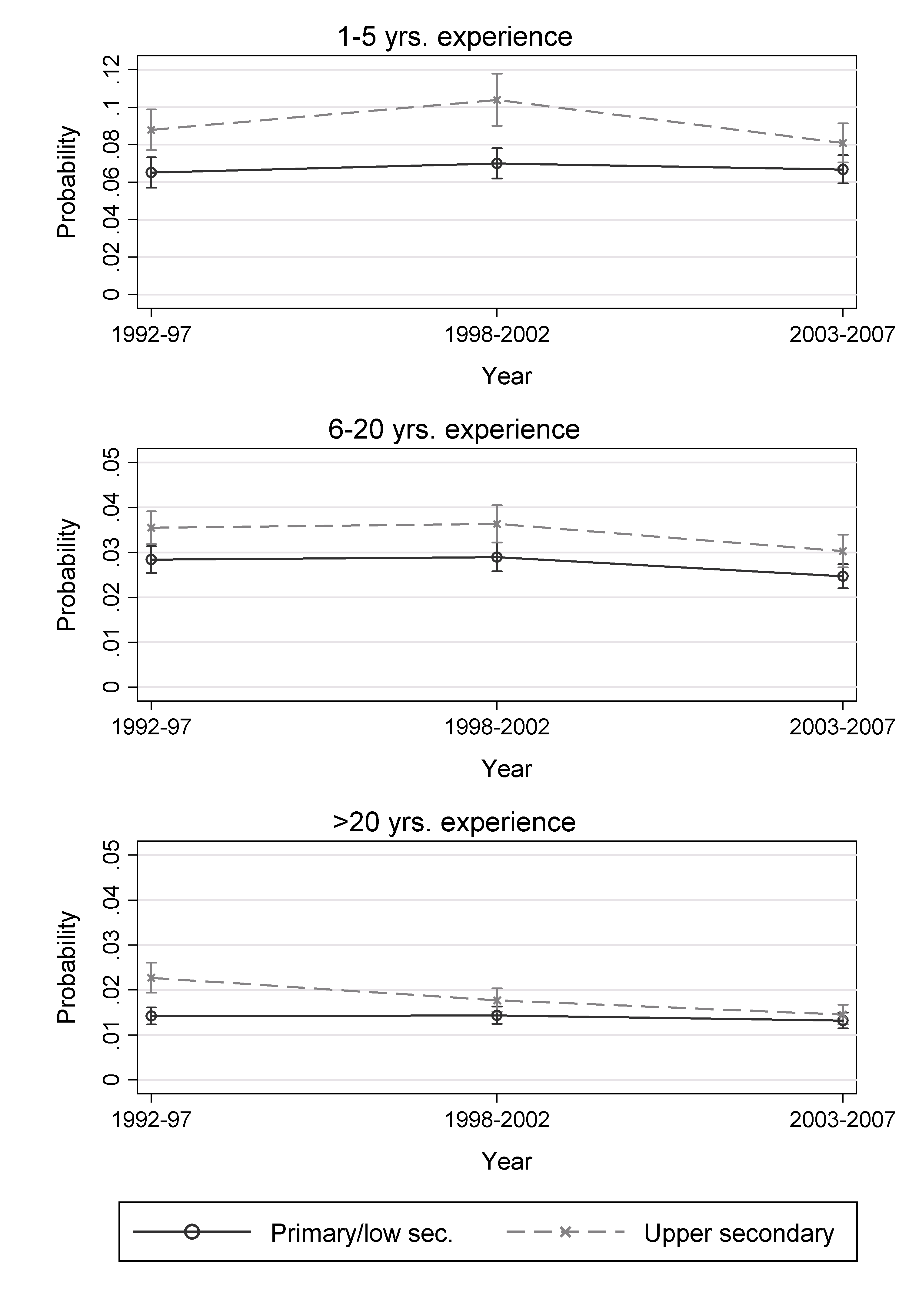
Figure 4 shows exits to other employment among teachers in three time periods: 1992–1997, 1998–2002, and 2003–2007 (along the x-axes). 8 Among early-career teachers, yearly attrition varied between 8% and 10% for upper secondary teachers and was approximately 7% for teachers in lower school levels. In the first two time periods, attrition levels were higher for upper secondary teachers, but in 2003–2007, the difference between school levels was smaller and not significant.
Among mid-career teachers (six to 20 years’ experience), annual attrition was much lower, between 2% and 4%. Attrition declined slightly in the last time period, and, although small, this difference is statistically significant (see Table A2). As among early-career teachers, those employed in primary/lower secondary are less prone to leave than upper secondary teachers.
Among late-career teachers (>20 years’ experience), annual attrition to other employment was only 1% to 2.5%. Whereas attrition levels were relatively stable over time for teachers employed in lower school levels, attrition decreased among experienced upper secondary teachers.
In line with previous research, attrition to other employment was highest among inexperienced teachers. Early-career attrition may represent a selection out of the profession of individuals who do not succeed as teachers. However, this finding also reflects the lower levels of job security facing recent graduates, not least because attrition here included teachers leaving to teach at a different school level. For late-career teachers, exits to other employment were quite rare. This is not surprising, given that these teachers are a select group, who thus far have stayed in the profession. Moreover, seniors often face greater difficulties in the labour market, and the costs of changing careers are likely higher after teachers settle into their professional roles.
Exits from the labour market
If alternative employment opportunities are reduced, this could drive increasing numbers of teachers to leave the labour market altogether. In particular, experienced teachers may become more inclined toward entering early retirement. Figure 5 shows attrition to non-employment by age for teachers in each school level, with separate graphs referring to different time periods. For all three periods, annual exit rates were low for teachers aged 60 years or younger. Attrition to non-employment increases sharply as teachers enter their 60s. Moreover, it is clear that the reduction of the early-retirement age in 1997/1998 affected attrition levels. For the first period (1992–1997), exits from the labour market were rare among teachers younger than 65 years. At 65 years, attrition increased sharply; 20% to 25% of teachers exited the labour market at this age, and 40% of the remaining teachers left at the age of 66 years 9 . Exit rates were somewhat lower among upper secondary teachers than among teachers employed in primary/lower secondary schools.
For the two later time periods, the risk of leaving employment was similar to that of the first time period until teachers reached the age of 63 years. However, after opportunities for early retirement improved in the late 1990s, there was a marked increase in exits among teachers aged 62 to 64 years. In 1998–2002 and 2003–2007, 25% of teachers employed in lower school levels and approximately 15% of teachers employed in upper secondary schools exited the labour market at the age of 63 years, compared with 2% in 1992–1997. Furthermore, approximately 15% of the remaining primary/lower secondary teachers and 20% of upper secondary teachers retired at age 64. The corresponding rates for the first period were 4% and 6%.
Figure 5.
Annual attrition rates, exits to non-employment (retirement-exits), by school level in a previous year, time period, and age. 95% CI error bars. Predicted for female, no children < 8, bachelor’s graduate in humanities with PGCE, no further education, residing in central municipality
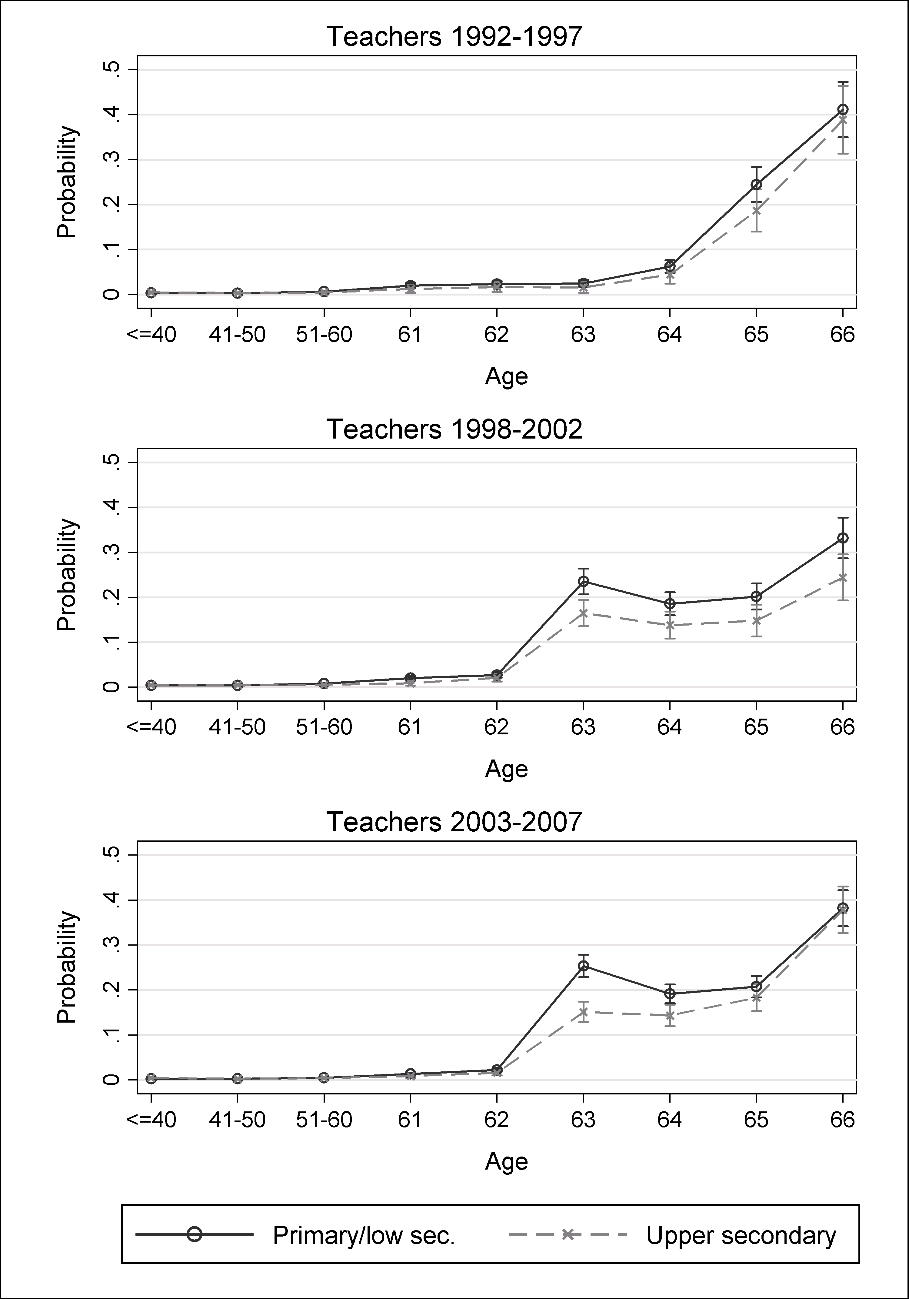
In summary, in all time periods, early exits from the labour market were more common among primary/lower secondary teachers than among upper secondary teachers. This difference was more marked after the retirement age was reduced.
Discussion and conclusion
Despite widespread concerns for teacher attrition in relation to what has been termed the intensification thesis (Van Droogenbroeck & Spruyt, 2014; Webb et al., 2004), there are few comprehensive studies on changes in attrition patterns of teachers over time. This paper, therefore, makes an important contribution in terms of examining broader attrition patterns over a relatively long time span. The first question raised was whether attrition is higher in recent cohorts graduating from teacher education compared with previous cohorts.
The analyses showed that attrition from the teaching profession was somewhat higher in cohorts graduating in the 1980s compared with cohorts graduating in the late 1970s, but that attrition declined in later cohorts. The general pattern was similar across teachers with different types of teacher education. For GTE teachers, attrition was at the highest in the early 1980s. It is important to note that this was a period characterized by relatively low demand for teachers and high demand in other sectors. In the late 1980s, Norway experienced a recession and unemployment increased. As this limited the opportunities for leaving, it is not surprising that attrition levels among GTE teachers declined. For PGCE graduates, there was no similar decline in attrition patterns during the recession years. However, the short duration of the PGCE means that graduates in this period also entered this course during the recession. That is, the higher risk of unemployment may also have increased recruitment to PGCE courses among graduates with relatively low motivation for teaching.
In the mid-1990s, after the PGCE was extended from one to two semesters, there was a decline in attrition among PGCE graduates. This may be related to differences in selection, as motivation for teaching may be higher among those entering this course after the costs associated with PGCE increased. However, for both PGCE and GTE teachers, there was an indication of a further decline in attrition in recent cohorts. This supports the assumption of a decrease in the transferability of teachers’ human capital to non-school employment. It is also possible that students’ knowledge about labour market conditions affects recruitment to teacher education and that recent graduates less often view teaching as a fallback career. In summary, the results from the cohort analyses suggest that changes in labour market opportunities have a greater impact on teacher attrition levels than changes in intrinsic rewards do.
Whereas cohort attrition is sensitive to the conditions in the labour market at the time of graduation, differences in annual attrition rates can give a clearer picture of how changes in teachers’ working conditions may have affected attrition for specific time periods. Because working conditions changed more in lower school levels, it was suggested that we would find evidence of increased attrition from primary/lower secondary schools compared with that from upper secondary schools. Based on previous research stating that late-career teachers are more negative toward educational change, it was expected that “intensification” would contribute to a particular increase in attrition in this group.
The analyses of annual attrition lend some support to these assumptions. Although overall attrition to other employment decreased between 1992 and 2007, attrition among teachers in lower school levels increased somewhat relative to upper secondary teachers. Attrition to other employment is generally higher for upper secondary teachers, but this difference declined over time, particularly among late-career teachers. Moreover, although early retirement increased markedly among teachers in both school levels after the retirement age was lowered in the late 1990s, this increase was largest in lower school levels. However, there is no evidence of a further increase in early retirement after the introduction of accountability policies around 2004. One explanation for this may be that these policies did not stand out in terms of contributing to increasing teachers’ motivation for leaving the profession. Rather, it could be that earlier educational reforms have had a similar impact on (experienced) teachers’ motivation to leave. It may also be that working in lower school levels is more physically and emotionally demanding, leading to more teachers at this level taking advantage of the opportunity for early retirement when available.
Overall, it is not clear that intensification has led to higher attrition. Several factors may contribute to this. First, it is possible that other factors such as economic incentives and the availability of attractive alternative employment opportunities play a larger role in teachers’ decisions to remain in or leave the profession. Second, it may be that, although teaching is changing, not all change is for the worse. Although frequently understood as symptoms of deterioration and deprofessionalization of teacher work, increasing responsibilities and demands may also be understood as increasing professionalization, making teaching more complex and skilled (Hargreaves, 1994). A development toward more collaborative teaching cultures potentially promotes teacher retention, as teachers may receive more social support.
The attrition rates reported here are relatively low compared with attrition levels reported in countries such as the United Kingdom and the United States, from which much of the attrition literature originates. Although heightened demands, increasing accountability, more “social work,” and growing amounts of paperwork seem to be fairly universal descriptions of how teachers’ work has changed in recent decades, the timing and degree of change vary between countries (Hargreaves, 1994; Webb et al., 2004). In Norway, accountability policies were introduced later than in many other countries. Moreover, these policies have limited consequences for teachers compared with more “high-stakes” policies in some countries. An additional aspect characterizing school employment in Norway is a relatively high level of flexibility. Good opportunities for part-time work and partial retirement are likely to contribute to lower levels of exits from the labour market.
As there is a lack of systematic analyses of changes in teacher attrition, it is difficult to compare the findings in this paper with results from previous research. Similar studies from countries with more high-stakes accountability regimes, where data are available for more comprehensive examinations of attrition patterns over time, would improve the understanding of the relationship between intensification of teachers’ work and teacher attrition. Furthermore, although increasing overeducation among higher education graduates is a tendency observed in several countries, differences in labour markets, economic conditions and relative pay may lead to different attrition patterns in different national contexts.
Although the observed trends indicate that intensification has not resulted in an increase in attrition, other parallel changes may have affected attrition in a reverse manner, preventing the detection of such patterns. The analytical design of this paper does not allow for firm causal interpretation. However, alternative explanations have been explored, by examining both attrition to non-employment and other employment, and by comparing teachers who were differently affected by educational reforms. Nevertheless, further research is needed to draw conclusions about the relationship between teachers’ working conditions and attrition.
A further limitation of this paper is that labour market outcomes were observed only until 2008 when accountability policies were still quite recent. If the process leading from dissatisfaction with working conditions to attrition develops over longer time periods, it may be too soon to examine the full effects of such policies on attrition. It is also worth asking whether low attrition in the face of increasing demands is entirely good news. Because the demand for teachers is high and teacher turnover causes instability in schools, it is generally desirable that teachers stay in the profession. However, if teachers are increasingly discontent and motivated to leave, but do not see the opportunity to do so, their job engagement could decline, ultimately decreasing the quality of schooling.
Notes
[i] However, all graduates from the selected graduation cohorts are included in the analyses so that individuals never entering teaching and those who leave before five years are included among the “leavers.”
[iii] The category also includes some types of educational administration because it was not possible to distinguish between administration and primary school employees in some of the years. However, administration comprised less than 2% of the teachers in the years in which the categories are distinguishable. Self-employed individuals are included in the non-teaching category.
[iv] The dependent variables are based on industry, self-employment, and income. Industry is coded according to ISIC Rev.2 between 1992 and 1995, NACE Rev.1 between 1996 and 2002 and NACE Rev.2 from 2003. Figure A1 in the appendix shows the proportion of graduates in each cohort in non-school employment according to each standard. Although the standards do not perfectly overlap, the differences between cohorts are not affected by the differences in codification.
[v] Because many schools comprise both primary and lower secondary levels, it is not possible to separate these levels.
[vi] Separate analyses by gender have also been tested, and although attrition is clearly higher among men, patterns over time are similar.
[vii] Information on academic performance was not available for GTE teachers, nor for all PGCE graduates. As this considerably reduced the numbers of teachers who could be included in the analyses, the models presented here do not include this variable.
References
- Aanensen, T. (2010). Lønnsutvikling for ansatte i skoleverket 1959–2008. [Wage development for employees in the school system 1959–2008]. Samfunnsøkonomen, 64(1), 4-11.
- Apple, M. W. (1986). Teachers and texts: A political economy of class and gender relations in education. London: Routledge.
- Arnesen, C. Å. (2002). Flukt fra lærer og førskolelæreryrket? ([Flight from teaching?]). Oslo: Nordic Institute for Studies of Innovation, Research and Education – NIFU. , (NIFUs skriftserie 8/02).
- Ballet, K., & Kelchtermans, G. (2009). Struggling with workload: Primary teachers’ experience of intensification. Teaching and Teacher Education, 25(8), 1150-1157. https://doi.org/10.1016/j.tate.2009.02.012
- Barone, C., & Ortiz, L. (2011). Overeducation among European University Graduates: A comparative analysis of its incidence and the importance of higher education differentiation. Higher Education, 61(3), 325-337. https://doi.org/10.1007/s10734-010-9380-0
- Becker, G. S. (1993). Human capital: A theoretical and empirical analysis, with special reference to education (3 ed.). Chicago, Ill.: NBER. https://doi.org/10.7208/chicago/9780226041223.001.0001
- Borman, G. D., & Dowling, N. M. (2008). Teacher attrition and retention: A meta-analytic and narrative review of the research. Review of Educational Research, 78(3), 367-409. https://doi.org/10.3102/0034654308321455
- Caspersen, J., Aamodt, P. O., Vibe, N., & Carlsten, T. C. (2014). Kompetanse og praksis blant norske lærere: Resultater fra TALIS-undersøkelsen i 2013, [Competence and practice among Norwegian teachers: Results from TALIS 2013]. Oslo: Nordic Institute for Studies of Innovation, Research and Education – NIFU.
- Chevalier, A., Dolton, P., & McIntosh, S. (2007). Recruiting and retaining teachers in the UK: an analysis of graduate occupation choice from the 1960s to the 1990s. Economica, 74(293), 69-96. https://doi.org/10.1111/j.1468-0335.2006.00528.x
- Fladmoe, A., & Leiulfsrud, H. (2013). How teachers experience the opinion climate on education in Norway and Finland. Nordic Studies in Education, 32(03-04), 03 159-04 176.
- Gail, M. H., Wieand, S., & Piantadosi, S. (1984). Biased estimates of treatment effect in randomized experiments with nonlinear regressions and omitted covariates. Biometrika, 71(3), 431-444. https://doi.org/10.1093/biomet/71.3.431
- Grissmer, D. W., & Kirby, S. N. (1992). Patterns of attrition among Indiana teachers, 1965-1987. Santa Monica, CA: Rand.
- Guarino, C. M., Santibanez, L., & Daley, G. A. (2006). Teacher recruitment and retention: a review of the recent empirical literature. Review of Educational Research, 76(2), 173-208. https://doi.org/10.3102/00346543076002173
- Hargreaves, A. (1994). Changing teachers, changing times: Teachers’ work and culture in the postmodern age. London: Cassell.
- Hargreaves, A. (2005). Educational change takes ages: Life, career and generational factors in teachers’ emotional responses to educational change. Teaching and Teacher Education, 21(8), 967-983. https://doi.org/10.1016/j.tate.2005.06.007
- Harris, D. N., & Adams, S. J. (2007). Understanding the level and causes of teacher turnover: A comparison with other professions. Economics of Education Review, 26(3), 325-337. https://doi.org/10.1016/j.econedurev.2005.09.007
- Hatch, T. (2013). Beneath the surface of accountability: Answerability, responsibility and capacity-building in recent education reforms in Norway. Journal of Educational Change, 14(2), 113-138. https://doi.org/10.1007/s10833-012-9206-1
- Hedström, P. (2005). Dissecting the Social: Social Mechanisms and the Principles of Analytical Sociology. Cambridge: Cambridge University Press. https://doi.org/10.1017/CBO9780511488801
- Høgsnes, G. (2000). Lønnsutvikling for ansatte i skoleverket. [Wage development for employees in the school system]. Søkelys på arbeidsmarkedet, 17(1), 77-87.
- Imsen, G., & Volckmar, N. (2014). The Norwegian school for all: Historical emergence and neoliberal confrontation. In U. Blossing, G. Imsen, & L. Moos (Eds.), The Nordic Education Model (pp. 35-55). The Netherlands: Springer Netherlands. https://doi.org/10.1007/978-94-007-7125-3_3
- Ingersoll, R., Merrill, L., & Stuckey, D. (2014). Seven trends: The transformation of the teaching force.. http://www.cpre.org/7trends
- Kyriacou, C., & Kunc, R. (2007). Beginning teachers’ expectations of teaching. Teaching and Teacher Education, 23(8), 1246-1257. https://doi.org/10.1016/j.tate.2006.06.002
- Lindqvist, P., Nordanger, U. K., & Carlsson, R. (2014). Teacher attrition the first five years – A multifaceted image. Teaching and Teacher Education, 40, 94-103. https://doi.org/10.1016/j.tate.2014.02.005
- Luekens, M. T., Lyter, D. M., & Fox, E. E. (2004). Washington, DC: Department of Education.
- Maskit, D. (2011). Teachers’ attitudes toward pedagogical changes during various stages of professional development. Teaching and Teacher Education, 27(5), 851-860. https://doi.org/10.1016/j.tate.2011.01.009
- Mastekaasa, A. (2011). Brain drain? Recruitment and retention of high quality teachers in Norway. Oxford Review of Education, 37(1), 53-74. https://doi.org/10.1080/03054985.2010.527730
- Mausethagen, S. (2013a). Accountable for what and to whom? Changing representations and new legitimation discourses among teachers under increased external control. Journal of Educational Change, 14(4), 423-444. https://doi.org/10.1007/s10833-013-9212-y
- Mausethagen, S. (2013b). A research review of the impact of accountability policies on teachers’ workplace relations. Educational Research Review, 9,, 16-33. https://doi.org/10.1016/j.edurev.2012.12.001
- Norwegian Ministry of Education. (1999). St.meld. nr 12 (1999–2000): … og yrke skal båten bera … Handlingplan for rekruttering til læraryrket [Action plan for recruitment to teaching]. Oslo: Norwegian Ministry of Education.
- Norwegian Ministry of Education and Research. (2009). Rapport fra tidsbrukutvalget [Report from the time-use commission] Oslo: Norwegian Ministry of Education and Research.
- OECD. (2005). Teachers matter: Attracting, developing and retaining effective teachers. Paris: OECD.
- Opheim, V. (2004). Like muligheter, men ulikt utbytte? Betydning av sosial bakgrunn for overgang fra utdanning til arbeid blant nyutdannede kandidater i perioden 1987-2001, [Equal opportunities, unequal outcomes? The impact of social background for the transition from education to work among recent graduates 1987-2001]. Oslo: Nordic Institute for Studies of Innovation, Research and Education – NIFU., 1987-2001.
- Pomaki, G., DeLongis, A., Frey, D., Short, K., & Woehrle, T. (2010). When the going gets tough: Direct, buffering and indirect effects of social support on turnover intention. Teaching and Teacher Education, 26(6), 1340-1346. https://doi.org/10.1016/j.tate.2010.03.007
- Purcell, K., Wilton, N., Davies, R., & Elias, P. (2005). Education as a graduate career: Entry and exit from teaching as a profession. London: Department for Education and Skills.
- Roness, D., & Smith, K. (2009). Postgraduate Certificate in Education (PGCE) and student motivation. European Journal of Teacher Education, 32(2), 111-134. https://doi.org/10.1080/02619760902778982
- Rovde, O. (2004). Vegar til samling: Norsk lærarlags historie 1966. Oslo: Samlaget.
- Schøne, P. (1999). Rekruttering av nyutdannede til undervisningssektoren-hva betyr lønn? [Recruitment of recent graduates to the education sector – what is the importance of pay?] Søkelys på arbeidsmarkedet, 99(16), 159-164.
- Skaalvik, E. M., & Skaalvik, S. (2010). Utfordringer i lærerrollen. [Challenges to the teacher role]. In R. Andreassen, E. J. Irgens, & E. M. Skaalvik (Eds.), Kompetent skoleledelse. Trondheim: Tapir akademisk forlag.
- Skaalvik, E. M., & Skaalvik, S. (2011). Teacher job satisfaction and motivation to leave the teaching profession: Relations with school context, feeling of belonging, and emotional exhaustion. Teaching and Teacher Education, 27(6), 1029-1038. https://doi.org/10.1016/j.tate.2011.04.001
- Smethem, L. (2007). Retention and intention in teaching careers: will the new generation stay? Teachers and Teaching: theory and practice, 13(5), 465-480. https://doi.org/10.1080/13540600701561661
- Smithers, A., & Robinson, P. (2005). Teacher turnover, wastage and movements between schools. London: Department for Education and Skills.
- Snartland, V., & Øverbye, E. (2003). Skal jeg bli eller skal jeg gå? Pensjonsforventninger hos lærere og ingeniører (Should I stay or should I go? Retirement prospects among teachers and engineers). Oslo: Norwegian Social Research - HiOA.
- Stinebrickner, T. R. (1998). An empirical investigation of teacher attrition. Economics of Education Review, 17(2), 127-136. https://doi.org/10.1016/S0272-7757(97)00023-X
- Stinebrickner, T. R. (2002). An analysis of occupational change and departure from the labor force – Evidence of the reasons that teachers leave. Journal of Human Resources, 37(1), 192-216. https://doi.org/10.2307/3069608
- Struyven, K., & Vanthournout, G. (2014). Teachers’ exit decisions: An investigation into the reasons why newly qualified teachers fail to enter the teaching profession or why those who do enter do not continue teaching. Teaching and Teacher Education, 43, 37-45. https://doi.org/10.1016/j.tate.2014.06.002
- Støren, L. A. (2014). Fører “mastersyke” til overutdanning? Om overgang fra studier til arbeidsliv. [Does “master’s inflation” lead to overeducation? On the transition from education to work]. In N. Frølich, E. Hovdhaugen, & L. I. Terum (Eds.), Kvalitet, kapasitet og relevans: Utviklingstrekk i norsk høyere utdanning (pp. 288-311). Oslo: Cappelen Damm akademisk.
- Turmo, A., & Aamodt, P. O. (2009). Forskjeller i lærerkompetanse i vidergående skole: Konsekvenser for elevenes læringsutbytte? [Differences in teachers’ competences in upper secondary schools: Consequences for student outcomes?] Norsk pedagogisk tidsskrift, 93(2), 122-134.
- Tveit, S. (2014). Educational assessment in Norway. Assessment in Education: Principles, Policy & Practice, 21(2), 221-237. https://doi.org/10.1080/0969594X.2013.830079
- van Droogenbroeck, F., & Spruyt, B. (2014). To stop or not to stop: An empirical assessment of the determinants of early retirement among active and retired senior teachers. Research on Aging, 36(6), 753-777. https://doi.org/10.1177/0164027513519449
- Watt, H. M., Richardson, P. W., Klusmann, U., Kunter, M., Beyer, B., Trautwein, U., & Baumert, J. (2012). Motivations for choosing teaching as a career: An international comparison using the FIT-Choice scale. Teaching and Teacher Education, 28(6), 791-805. https://doi.org/10.1016/j.tate.2012.03.003
- Webb, R., Vulliamy, G., Hämäläinen, S., Sarja, A., Kimonen, E., & Nevalainen, R. (2004). Pressures, rewards and teacher retention: A comparative study of primary teaching in England and Finland. Scandinavian Journal of Educational Research, 48(2), 169-188. https://doi.org/10.1080/0031383042000198530
- Zou, G. (2004). A modified poisson regression approach to prospective studies with binary data. American Journal of Epidemiology, 159(7), 702-706. https://doi.org/10.1093/aje/kwh090
Appendix
Table A1
Cohort attrition. Poisson regression with cluster robust SE, exponentiated coefficients. Dependent variable: Not employed in school-sector. Reference is 1975-1979 graduation cohort, male, no children under 8, residing in low centrality region, not in further education, humanities graduate (PGCE), bachelor's degree (PGCE bachelor /GTE)
|
PGCE Bachelor |
PGCE Master |
GTE |
||||
|---|---|---|---|---|---|---|
|
Cohort |
||||||
|
1980-1984 |
1.162*** |
[1.070,1.263] |
1.278*** |
[1.162,1.405] |
1.140*** |
[1.080,1.204] |
|
1985-1989 |
1.316*** |
[1.204,1.440] |
1.416*** |
[1.258,1.593] |
0.988 |
[0.926,1.054] |
|
1990-1994 |
1.335*** |
[1.229,1.451] |
1.556*** |
[1.404,1.724] |
0.856*** |
[0.801,0.914] |
|
1995-1999 |
1.134** |
[1.031,1.247] |
1.125 |
[0.994,1.274] |
0.790*** |
[0.738,0.846] |
|
2000-2005 |
1.061 |
[0.949,1.188] |
0.955 |
[0.820,1.112] |
0.703*** |
[0.647,0.763] |
|
Time 1) |
1.018*** |
[1.010,1.026] |
1.016** |
[1.006,1.025] |
1.031*** |
[1.023,1.039] |
|
Time 2) |
0.985** |
[0.975,0.994] |
0.993 |
[0.982,1.005] |
0.969*** |
[0.960,0.979] |
|
Female |
0.898*** |
[0.846,0.954] |
0.871*** |
[0.805,0.942] |
0.628*** |
[0.598,0.659] |
|
Child<1 |
1.019 |
[0.944,1.100] |
1.175*** |
[1.077,1.283] |
0.865*** |
[0.814,0.921] |
|
Child 1-3 |
1.059 |
[0.990,1.134] |
1.139** |
[1.053,1.232] |
0.882*** |
[0.834,0.932] |
|
Child 4-7 |
0.992 |
[0.933,1.055] |
1.082* |
[1.013,1.155] |
0.924** |
[0.880,0.971] |
|
Female X Child<1 |
0.965 |
[0.867,1.073] |
0.914 |
[0.796,1.049] |
1.188*** |
[1.096,1.287] |
|
Female X Child 1-3 |
0.909* |
[0.827,0.998] |
0.986 |
[0.878,1.108] |
1.382*** |
[1.288,1.482] |
|
Female X Child 4-7 |
0.919 |
[0.841,1.004] |
0.91 |
[0.819,1.010] |
0.998 |
[0.934,1.066] |
|
Age graduation |
0.991*** |
[0.986,0.995] |
0.989** |
[0.982,0.997] |
0.985*** |
[0.981,0.990] |
|
In furth. educ. |
1.212*** |
[1.162,1.265] |
1.296*** |
[1.218,1.378] |
1.172*** |
[1.132,1.215] |
|
Centrality lev. 2 |
1.129 |
[0.963,1.322] |
1.335* |
[1.017,1.752] |
1.053 |
[0.963,1.152] |
|
Centrality lev. 3 |
1.155* |
[1.011,1.318] |
1.364** |
[1.094,1.700] |
1.053 |
[0.977,1.135] |
|
Centrality lev. 4 |
1.372*** |
[1.224,1.537] |
1.634*** |
[1.341,1.992] |
1.245*** |
[1.166,1.330] |
|
Centrality lev. 5 |
1.898*** |
[1.702,2.117] |
2.325*** |
[1.918,2.820] |
1.797*** |
[1.682,1.919] |
|
Social science |
1.293*** |
[1.217,1.374] |
1.727*** |
[1.571,1.900] |
||
|
Science |
1.242*** |
[1.161,1.328] |
1.486*** |
[1.384,1.596] |
||
|
Master degree |
1.467*** |
[1.393,1.544] |
|
|
2.289*** |
[2.170,2.414] |
|
Observations |
93009 |
38027 |
316378 |
|||
|
N Individuals |
11637 |
4948 |
40440 |
|||
|
Log lik. |
-61704 |
-28487 |
-147166 |
|||
|
Chi2 |
1146.861 |
826.104 |
3546.528 |
|||
|
p |
0 |
|
0 |
|
0 |
|
95% confidence intervals in brackets
* p<0.05, ** p<0.01, *** p<0.001
1) Linear time spline 5-10 years since graduation
2) Linear time spline 11-20 years since graduation
Table A2
Employment-exit. Poisson regression with cluster robust SE, exponentiated coefficients. Dependent variable: Not employed in same school level. Reference is first time-period (1992-1997), GTE graduate, employed in primary/lower secondary, male, no children<8, low centrality municipality, not in further education, no master’s degree. Separate models for teachers in different career-stages.
|
Model 1 |
Model 2 |
Model 3 |
||||
|---|---|---|---|---|---|---|
|
1-5 years’ experience |
6-20 years’ experience |
>20 years’ experience |
||||
|
Period |
||||||
|
1998-2002 |
1.073 |
[0.992,1.160] |
1.019 |
[0.961,1.081] |
1.012 |
[0.945,1.084] |
|
2003-2007 |
1.025 |
[0.948,1.108] |
0.869*** |
[0.820,0.921] |
0.930* |
[0.865,0.999] |
|
Up.sec. |
1.350*** |
[1.189,1.532] |
1.250*** |
[1.137,1.373] |
1.600*** |
[1.410,1.815] |
|
1998-2002 X Up.sec. |
1.101 |
[0.948,1.278] |
1.004 |
[0.903,1.117] |
0.770*** |
[0.676,0.877] |
|
2003-2007 X Up.sec. |
0.898 |
[0.777,1.037] |
0.981 |
[0.876,1.099] |
0.689*** |
[0.601,0.789] |
|
Age |
0.979*** |
[0.974,0.983] |
0.968*** |
[0.964,0.972] |
0.959*** |
[0.953,0.964] |
|
Female |
0.823*** |
[0.766,0.884] |
0.847*** |
[0.795,0.903] |
0.753*** |
[0.709,0.800] |
|
Child<1 |
0.891 |
[0.780,1.019] |
0.908 |
[0.786,1.050] |
1.670* |
[1.021,2.733] |
|
Child 1-3 |
0.876* |
[0.784,0.978] |
1.016 |
[0.927,1.113] |
1.155 |
[0.856,1.560] |
|
Child 4-7 |
0.912 |
[0.769,1.081] |
1.002 |
[0.916,1.095] |
1.133 |
[0.928,1.383] |
|
Female X Child<1 |
0.644*** |
[0.539,0.770] |
0.763** |
[0.632,0.922] |
0.789 |
[0.107,5.817] |
|
Female X Child 1-3 |
1.154* |
[1.004,1.325] |
0.915 |
[0.816,1.025] |
0.32 |
[0.100,1.027] |
|
Female X Child 4-7 |
0.883 |
[0.709,1.100] |
0.827** |
[0.737,0.927] |
0.828 |
[0.592,1.159] |
|
Centrality lev. 2 |
1.225** |
[1.084,1.384] |
0.934 |
[0.841,1.036] |
0.863* |
[0.765,0.974] |
|
Centrality lev. 3 |
1.085 |
[0.976,1.207] |
0.973 |
[0.893,1.060] |
0.874** |
[0.793,0.963] |
|
Centrality lev. 4 |
1.042 |
[0.949,1.145] |
1.049 |
[0.973,1.131] |
0.986 |
[0.906,1.074] |
|
Centrality lev. 5 |
1.275*** |
[1.162,1.400] |
1.220*** |
[1.128,1.321] |
1.084 |
[0.986,1.193] |
|
Master |
1.306*** |
[1.189,1.433] |
1.694*** |
[1.556,1.844] |
1.388*** |
[1.227,1.571] |
|
PGCE Humanities |
1.855*** |
[1.692,2.033] |
1.04 |
[0.950,1.139] |
0.699*** |
[0.619,0.788] |
|
PGCE Soc.science |
2.204*** |
[1.975,2.459] |
1.489*** |
[1.333,1.663] |
1.274*** |
[1.115,1.456] |
|
PGCE Science |
1.744*** |
[1.521,1.999] |
0.787*** |
[0.691,0.896] |
0.563*** |
[0.484,0.654] |
|
In further educ. |
1.510*** |
[1.411,1.615] |
1.560*** |
[1.459,1.667] |
1.523*** |
[1.374,1.689] |
|
Observations |
114498 |
|
280526 |
|
336181 |
|
|
N Individuals |
34803 |
47905 |
39498 |
|||
|
Log lik. |
-21507 |
-38989 |
-30895 |
|||
|
Chi2 |
1845.309 |
1356.947 |
792.651 |
|||
|
p |
0 |
|
0 |
|
0 |
|
95% confidence intervals in brackets
* p<0.05, ** p<0.01, *** p<0.001
Table A3
Retirement-exits. Poisson regression with cluster robust SE, exponentiated coefficients. Dependent variable: Not employed. Reference is GTE graduate, age 40 or younger, employed in primary/lower secondary, male, no children<8, low centrality municipality, not in further education, no master’s degree. Separate models for different time-periods
|
Model 1 |
Model 2 |
Model 3 |
||||
|---|---|---|---|---|---|---|
|
|
1992- 97 |
1998-02 |
2003-2007 |
|||
|
Age |
||||||
|
41-50 |
0.810** |
[0.698,0.940] |
1.069 |
[0.908,1.259] |
1.025 |
[0.814,1.291] |
|
51-60 |
1.584*** |
[1.352,1.855] |
2.118*** |
[1.814,2.472] |
1.631*** |
[1.332,1.997] |
|
61 |
4.896*** |
[3.642,6.583] |
5.014*** |
[3.920,6.414] |
4.770*** |
[3.655,6.224] |
|
62 |
5.605*** |
[4.159,7.555] |
6.783*** |
[5.370,8.566] |
8.062*** |
[6.377,10.192] |
|
63 |
6.005*** |
[4.433,8.134] |
58.263*** |
[50.263,67.535] |
91.199*** |
[76.576,108.613] |
|
64 |
15.114*** |
[12.114,18.857] |
45.991*** |
[39.150,54.026] |
68.880*** |
[57.434,82.606] |
|
65 |
59.173*** |
[50.747,68.998] |
49.949*** |
[42.256,59.044] |
74.583*** |
[61.945,89.798] |
|
66 |
99.508*** |
[86.105,114.998] |
82.160*** |
[70.060,96.349] |
137.425*** |
[114.826,164.472] |
|
Up.sec. |
1.237* |
[1.012,1.511] |
1.427** |
[1.127,1.806] |
1.643*** |
[1.228,2.199] |
|
41-50X Up.sec. |
0.904 |
[0.678,1.206] |
0.827 |
[0.589,1.159] |
0.596* |
[0.363,0.977] |
|
51-60X Up.sec. |
0.628** |
[0.461,0.854] |
0.470*** |
[0.347,0.638] |
0.602** |
[0.415,0.875] |
|
61 X Up.sec. |
0.505 |
[0.235,1.085] |
0.314*** |
[0.162,0.611] |
0.402** |
[0.221,0.734] |
|
62 X Up.sec. |
0.594 |
[0.286,1.234] |
0.543* |
[0.329,0.898] |
0.436** |
[0.265,0.718] |
|
63 X Up.sec. |
0.52 |
[0.232,1.168] |
0.492*** |
[0.373,0.648] |
0.363*** |
[0.266,0.497] |
|
64 X Up.sec. |
0.578* |
[0.343,0.975] |
0.521*** |
[0.382,0.710] |
0.456*** |
[0.330,0.632] |
|
65 X Up.sec. |
0.617** |
[0.458,0.832] |
0.515*** |
[0.371,0.714] |
0.538*** |
[0.388,0.746] |
|
66 X Up.sec. |
0.764* |
[0.595,0.981] |
0.515*** |
[0.380,0.699] |
0.603** |
[0.443,0.821] |
|
Female |
1.201*** |
[1.106,1.305] |
1.214*** |
[1.135,1.298] |
1.05 |
[0.994,1.109] |
|
Child<1 |
0.657 |
[0.350,1.233] |
0.194** |
[0.062,0.606] |
0.148** |
[0.036,0.597] |
|
Child 1-3 |
0.855 |
[0.603,1.213] |
0.503** |
[0.318,0.797] |
0.566* |
[0.353,0.907] |
|
Child 4-7 |
0.682* |
[0.473,0.982] |
0.522** |
[0.332,0.821] |
0.576* |
[0.352,0.944] |
|
Female X Child<1 |
3.462*** |
[1.797,6.672] |
9.217*** |
[2.901,29.286] |
9.768** |
[2.373,40.212] |
|
Female X Child 1-3 |
5.986*** |
[4.228,8.475] |
8.831*** |
[5.564,14.018] |
4.286*** |
[2.673,6.872] |
|
Female X Child 4-7 |
2.627*** |
[1.774,3.891] |
2.543*** |
[1.557,4.155] |
1.811* |
[1.044,3.142] |
|
Centrality lev. 2 |
0.993 |
[0.855,1.153] |
0.951 |
[0.835,1.084] |
0.916 |
[0.823,1.019] |
|
Centrality lev. 3 |
0.994 |
[0.875,1.130] |
1.07 |
[0.966,1.185] |
1.004 |
[0.923,1.091] |
|
Centrality lev. 4 |
1.134* |
[1.011,1.272] |
1.005 |
[0.915,1.103] |
0.937 |
[0.869,1.010] |
|
Centrality lev. 5 |
1.235*** |
[1.092,1.396] |
1.011 |
[0.911,1.121] |
0.952 |
[0.873,1.039] |
|
Master |
0.765*** |
[0.659,0.888] |
0.854* |
[0.756,0.963] |
0.788*** |
[0.716,0.868] |
|
PGCE Humanities |
1.018 |
[0.899,1.153] |
0.958 |
[0.865,1.061] |
0.988 |
[0.908,1.076] |
|
PGCE Soc.science |
1.056 |
[0.914,1.220] |
0.911 |
[0.784,1.058] |
0.975 |
[0.856,1.110] |
|
PGCE Science |
0.984 |
[0.826,1.173] |
0.996 |
[0.879,1.128] |
0.92 |
[0.829,1.021] |
|
In further educ. |
4.326*** |
[3.870,4.834] |
2.739*** |
[2.436,3.080] |
2.304*** |
[1.980,2.681] |
|
Observations |
257538 |
|
226399 |
|
259851 |
|
|
N Individuals |
54409 |
58215 |
63819 |
|||
|
Log lik. |
-13361 |
-16242 |
-17056 |
|||
|
Chi2 |
12635.791 |
13094.502 |
15100.74 |
|||
|
p |
0 |
|
0 |
|
0 |
|
95% confidence intervals in brackets
* p<0.05, ** p<0.01, *** p<0.001