![]()
Jon Strype, Helene O.I. Gundhus, Marit Egge and Atle Ødegård
Perceptions of Interprofessional Collaboration
Abstract: Interprofessional collaboration has been described both as an opportunity to meet the demands of a complex society, but also as a potential threat to professional autonomy. Interprofessional relationships are central in collaborative efforts, and there is a need to investigate the psychosocial processes involved. In the present study, we have investigated how professionals in a collaborative effort perceive collaboration, and how these perceptions are organized. We have used an adaptation of the Perception of Interprofessional Collaboration Model Questionnaire—PINCOM-Q—to develop and test a model of collaboration perceptions in a sample of professionals working within local crime prevention at the community level. Using a confirmatory factor analysis approach, we have found support for a three-dimensional conceptualisation of how interprofessional collaboration is perceived. We have labelled the dimensions in the model as follows: Group Climate, Influence, and Personal Motivation. Our results implicate that the development of interprofessional collaboration should emphasize supportive group communication, an equal distribution of group influence, and finally, a personal value outcome gained from participating in the collaboration.
Keywords: interprofessional collaboration; perception; PINCOM-Q; factor analysis; structural equation modelling
It is recognized that targeted and specialized expertise is needed in order to prevent health-, welfare-, or social problems, but it is also emphasized that professionals should collaborate across organisational boundaries in order to acknowledge the complexity of problems and to meet the demands of a knowledge-based society (Edwards, Daniels, Gallagher, Leadbetter, & Warmington, 2009; Pihl, 2009). The field of crime prevention is no exception in this respect.
In Norway, preventing youth crime at the community level is acknowledged in official policy as a multiple agency task implying interprofessional collaboration between the agencies involved (Norwegian Police Directorate, 2005). This policy is in line with the recommendations of a recent meta-analysis of crime prevention programs, which emphasize the importance of a multimodal approach in which both proximal (individual) and distal (community level) risk factors are addressed (Deković, Slagt, Asscher, Eichelsheim, & Prinzie, 2011).
Interprofessional collaboration has been described as local systems of distributed expertise (Edwards et al., 2009), in which cognition and problem solving is socially distributed (Måseide, 2008). The degree to which such systems are functional in order to achieve the desired ends may depend on the processes going on within the collaborating systems. One such process is related to the interaction between participants in a collaborative effort. The relationship between the professionals plays a central role in problem definition and decision making (Måseide, 2008). The relational dimension may in turn be influenced by how collaboration is perceived; some may for example see interprofessional collaboration as a threat to traditional professional autonomy (Pihl, 2011), which in turn may impair collaboration processes. On the other hand, interprofessional collaboration can also be perceived as an opportunity to provide better and more relevant services to society, and thus have a positive value to the professionals involved.
In crime prevention programs, collaboration has been associated with several advantages, for example, it affords a holistic approach to crime and it allows co-ordination of efforts, expertise, and information (Crawford, 1998; Gilling, 2005). However, since the 1980s, a well-established body of research in England and Wales has shown the limits of collaboration in multi-agency work and its associated conflicts. These are related to well-known tensions in the interdependent system of professions (Abbott, 1988) and competing organisational performance indicators (Hughes, 2007; Crawford, 1998). Thus, the ambiguity of collaboration, and the consequences of collaboration processes, calls for a stronger research effort in the field.
As indicated above, collaboration is an activity that is formed by the involved professionals and their perceptions of collaboration. As such, perceptions of collaboration constitute an important research subject as a means of understanding what is going on in interprofessional settings. However, a first and necessary step, which we will address in this study, is to establish a methodologically sound conceptual basis for further studies of how professionals perceive collaboration. This is in line with earlier research on the complexities of team performance (Mathieu, Maynard, Rapp & Gilson, 2008), also underpinning a need for studies elaborating a conceptual framework for further developments of interprofessional collaboration. Further, a systematic review of interventions based on interprofessional collaboration points to the need for valid and reliable conceptualisation and measurement of collaboration issues (Zwarenstein, Goldman & Reeves, 2009). Thus, our purpose with the present study is to investigate collaboration perceptions as they unfold in the context of community-based crime prevention co-ordination in Norway and to develop and test a conceptual model of dimensions in perceived collaboration. The aim is to identify the dimensions underlying participants’ views involved in shaping interprofessional collaboration.
Local crime-preventive enterprises
In Norway, various interprofessional collaborations target youth delinquency, and with different aims. Some of them, as the “follow-up teams,” are aimed to support single youths who have already committed several crimes. Other efforts, as the Co-ordination of Local Crime Preventive enterprises (CLCP), are oriented towards revealing trends in youth groups and their environment, and developing specific preventive efforts at an early stage. The idea is that the police and professionals in schools, social welfare and health services together will detect and initiate more knowledge-based interventions against youth crime. In 1989, the Norwegian National Crime Prevention Council took an initiative to establish an organisational model for CLCP. The CLCP model was gradually implemented in a substantial number of Norwegian municipalities. In 2012, 185 CLCP coordinators were registered in Norway’s 429 municipalities. The model comprises a steering committee, a working committee and an appointed CLCP coordinator, in addition to the practitioners who do the actual crime preventive work in the municipality. The steering committee provides the superordinate framework for efforts to prevent youth crime in the municipality. Its members include officials at the executive level in the municipality and local police officers. In the working committee, intermediate executives from organisations such as police, schools, social welfare, and health services are represented, and the function of the working committee is the practical co-ordination of crime prevention work. The CLCP coordinator is active on all levels of the model and is responsible for the information flow between levels.
The working committees meet regularly to discuss different challenges with youths in the community, to make more strategic crime prevention initiatives and to evaluate ongoing and completed efforts. According to the CLCP model manual (Fridhov & Karlgård, 2005), the working committee should be broadly constituted, to reflect diverse professional and non-professional experience with young people and crime. An evaluation shows that in the working committees, social welfare and drug related care, education, the police, and health services have the strongest representation (Gundhus, Egge, Strype, & Myhrer, 2008). It also concludes that interprofessional collaboration is depending on the formal framework facilitating collaboration and informal frames, as for example social relations between the different individuals collaborating. The practical collaboration is therefore developed within a formal framework, but is highly influenced by the relations developed between the collaborative participants. Gundhus et al. (2008) have also found that the CLCP coordinators emphasized that several skills and areas of knowledge are needed in CLCP work: the ability to work together as professionals from various disciplines, to communicate and to handle complex processes and community development.
Perception of collaboration—methodological developments
Numerous concepts (and conceptual models) attempt to give meaning to the phenomenon of collaboration (Leathard, 2003; Barr, Koppel, Reeves, Hammick, & Freeth, 2005). In recent years, an increasing amount of research on collaboration within health and social care has focused on the development of research instruments to tap various aspects of collaboration as perceived by practitioners and/or students engaged in interprofessional learning activities (Barr et al., 2005; Reeves et al., 2010). For example, new quantitative research instruments have been used to identify central aspects of interprofessional collaboration. These include the Readiness for Interprofessional Learning Scale (McFadyen et al., 2005), the Attitudes to Health Professionals Questionnaire (AHPQ) (Lindqvist, Duncan, Shepstone, Watts, & Pearce, 2005), Evaluating Integrated Health Care (Ahgren & Axelsson, 2005), the Index of Interprofessional Collaboration (Bronstein, 2002) and the Perception of Interprofessional Collaboration Model Questionnaire, or PINCOM-Q (Ødegård, 2006; Ødegård, Hagtvet, & Bjørkly, 2008; Ødegård & Strype, 2009). However, the majority of instruments trying to measure different aspects of interprofessional collaboration are in an early phase of psychometric and conceptual development (Thannhauser, Russell-Mayhew, & Scott, 2010).
The decision to explore the PINCOM-Q questionnaire further in the present study was informed by the fact that the instrument has shown promising results with regard to reliability and validity scores for the subscales in the instrument (Rousseau, Laurin-Lamothe, Nadeau, Deshaies, & Measham, 2012). Ødegård (2006) has suggested that collaboration might be understood as a multifactorial phenomenon including perceptions at the individual-, group-, and organisational levels (three subscales). For example, collaboration processes involving participants' motivation to engage with other professions, manners of coping with assigned tasks by groups attempting to collaborate and organisational cultures may be seen very differently with regard to daily practice. In the present study, two subscales from PINCOM-Q were explored (individual- and group level) as our main concern was perception of interprofessional collaboration within the CLCP groups.
Aims
There is a need for developments in conceptualisation and measurement of collaboration issues (Zwarenstein et al., 2009). Thus, the main aim of this study was to develop and test a conceptual model of how interprofessional collaboration is perceived by professionals in the CLCP collaboration, and by doing that, to provide concepts relevant to further studies of promoting and inhibiting factors in interprofessional collaboration.
It would also be highly relevant to investigate the factors that affect the respondents’ perceptions, and also the consequences these perceptions have. However, having in mind that we set out to investigate psychometrically valid concepts for perception of collaboration, these questions are beyond the scope of this article, and will be targeted subsequently.
Methods
Sample
We distributed questionnaires electronically to all 874 participants in CLCP working committees in Norway. After three reminders, 494 members of working committees had responded, yielding a response rate of 56.5%. For the sake of homogeneity in the present study, people who had double functions—that is, on both the working committee and the steering committee—were excluded, yielding a final sample of 467 respondents.
The sample was homogeneous in the sense that all respondents actively engaged in local community crime prevention efforts, and they were all members of CLCP working committees. In terms of educational, professional, and organisational backgrounds, the sample should be characterized as relatively heterogeneous (see table 1), reflecting the interprofessional and interagency constitution of CLCP collaboration. The sample must be considered as a convenience sample, based on easy availability of respondents. Consent from the professionals was obtained by voluntary participation.
Design
We performed both exploratory and confirmatory factor analyses in order to explore and test a model of collaboration perceptions in the crime prevention context. We proposed a model using exploratory factor analysis (EFA), and then we tested this model within a confirmatory factor analysis (CFA) framework.
Materials and procedure
A multidimensional questionnaire—the Perception of Interprofessional Collaboration Model Questionnaire (PINCOM-Q)—was adapted in the study (Ødegård, 2006; Ødegård et al. 2008). This self-report instrument measures subjective perceptions of collaboration. Prior empirical studies have shown that the questionnaire is well suited for exploring perceptions of collaboration among professionals working with children and adolescents; internal reliability coefficients have been promising: Cronbach’s alpha = .91 (48 items); split half alpha = .84 for part 1 and .87 for part 2 (Ødegård, 2006). Construct validity has been considered high in several studies because factor solutions (Ødegård, 2006) and generalizability coefficients (Ødegård et al., 2008) have been meaningful.
In the present study, we used a modified and refined version of the PINCOM-Q, and it was adapted to the present context. For example, “the CLCP working committee” replaced the more general term “interprofessional group”. The items were formulated as statements and rated on a seven-point scale, ranging from “strongly agree” (1) to “strongly disagree” (7).
From the original PINCOM-Q questionnaire (Ødegård, 2006), 18 items representing perceptions of interprofessional collaboration were included in the present study. The selected items were related to perceptions at an individual level (work motivation, professional power, and role expectancies) and at a group level (social support, communication, group leadership, and coping abilities).
Statistical analyses
Reanalysing the data with exploratory factor analysis was needed in order to develop a hypothesis of the factor structure in the present data. We tested the structure emerging from the exploratory factor analysis as a hypothetical model within the confirmatory factor analysis framework. In sum, this analytical strategy could contribute to the formulation of a viable model of collaboration perceptions in the crime prevention context.
We randomly divided the total sample into two data subsets. We used subset 1 (N = 236) in the exploratory analyses, and subset 2 (N = 231) in the confirmatory analyses. Researchers have noted that it is complicated to assess statistical power in the framework of structural equation modelling (Brown, 2006). Rules of thumb suggest a minimum sample size of 200 (Hoe, 2008; Kenny, 2012) or N in the range of 100–200 (Brown, 2006). Brown (2006) has further suggested that ‘sample size requirements should be evaluated in the context of the particular dataset and model at hand’ (p. 412). Given that the use of structural equation modelling in interprofessional collaboration research must be considered a new and exploratory approach, although some previous examples exist (Kenaszchuk, Reeves, Nicholas, & Zwarenstein, 2010), sample sizes of N = 236 and N = 231 for the two groups in this study were considered sufficient.
Results
Exploratory factor analysis
Initially, we performed tests to check the factorability of the 18 PINCOM-Q items. The Kaiser–Meyer–Olkin (KMO) measure of sampling adequacy was .91, well above the recommended value of 0.5. Bartlett’s test of sphericity was also performed, testing the null hypothesis that the variables are uncorrelated (i.e., that the correlation matrix is an identity matrix). In our material, however, this null hypothesis was rejected (χ2 (153) = 3021.71, p < .01). Thus, our data met the basic criteria to fit a factor analytic design. Common factor analysis, or more specifically, principal axis factor analysis, was applied because the primary purpose of this study was to detect the underlying latent variables that cause the manifest variables to co-vary (Reise, Waller, & Comrey, 2000; Costello & Osborne, 2005).
To determine the numbers of factors to be extracted, the eigenvalues were inspected first. The eigenvalue criterion states that the factors with an eigenvalue greater than 1.00 should be extracted. In our material, the eigenvalue criterion suggested extraction of a maximum of three factors (see Table 2). The scree plot also suggested a solution with three factors. In addition, we applied a modified scree plot criterion (see Jackson, 1993). In this technique, a second scree plot generated by random data is superimposed on the scree plot of the actual, structured data. The point where the two lines cross indicates the maximum limit of interpretable factors. This test also suggested a maximum limit of three factors. A final consideration regarding the number of factors to extract was related to the amount of variance explained. As can be seen in Table 2, three factors explained 72.5% of the variance in the original items.
Table 2
Eigenvalues, Percentage of Explained Variance and Cumulative Percentage of Explained Variance
| Component | Eigenvalue | Percentage of variance | Cumulative percentage of variance |
|---|---|---|---|
| 1 | 8.528 | 47.377 | 47.377 |
| 2 | 2.890 | 16.053 | 63.430 |
| 3 | 1.637 | 9.096 | 72.527 |
With the above-mentioned considerations and interpretability in mind, a three-factor solution was preferred. Preliminary analyses showed that the factor structure, in terms of factor content, was very similar with either oblique ( oblimin) or orthogonal ( varimax) rotations, indicating that an orthogonal rotation should be employed ( Pedhazur & Schmelkin, 1991) This view was further strengthened by the fact that an orthogonal rotation produced a smaller number of cross-loadings than an oblique rotation Consequently, we chose an orthogonal factor rotation, because it provided the best-defined factor structure, as compared with an oblique rotation The rotated factor loading matrix is shown in Table 3 Numbers in bold print indicate items with loadings above 60 on the respective factors We excluded items with cross-loadings above 40 from their respective factors ( and thus, these items are not marked in bold print)
Table 3
Matrix of Factor Analysis with Varimax Rotation (18 Items)
| Item | Factor | ||
|---|---|---|---|
| Ⅰ | Ⅱ | Ⅲ | |
| 1. I find that I am appreciated by other members of the working committee I participate in. | .856 | –.243 | .195 |
| 2. I have almost never found that the other working committee members do not understand what I am trying to explain or report. | .845 | –.170 | .168 |
| 3. I find that the other members in the working committee I participate in are willing to listen to me if I have problems. | .810 | –.185 | .274 |
| 4. It is important that the leader of the working committee arranges the work in ways that help the committee reach its goals. | .699 | –.077 | .054 |
| 5. The personal engagement of the group participants is often of great importance for collaboration in the working committee. | .686 | –.110 | 235 |
| 6. It is my experience that I can get help and social support from the other participants in the working committee. | .671 | –.133 | .450 |
| 7. The participants in the working committee are good at exchanging information with each other about how they work. | .633 | –.217 | .363 |
| 8. In the working committee I participate in, information is exchanged easily | .616 | –.221 | .333 |
| 9. I often experience that well-functioning working committees have a clear and defined leader. | .472 | –.152 | .442 |
| 10. Some professionals provide the assumptions for the working committee. | –.103 | .917 | .022 |
| 11. The viewpoints of some professionals dominate the working committee meetings. | .059 | .899 | –.087 |
| 12. Occasionally, the working committee does not function well because some professionals dominate the meetings. | –.423 | .774 | –.104 |
| 13. Sometimes, I am not able to present my perspectives because others use their professional power and talk all the time. | –.503 | .746 | –.002 |
| 14. The participants in the working committee are often frustrated with each other. | –.524 | .604 | –.042 |
| 15. I experience personal growth when I participate in the working committee. | .335 | –.023 | .800 |
| 16. I get to use my creativity and imagination when I participate in the working committee. | .182 | .022 | .778 |
| 17. I find participating in the working committee valuable. | .465 | –.156 | .710 |
| 18. I always have clear goals when I participate in the working committee. | .036 | .011 | .695 |
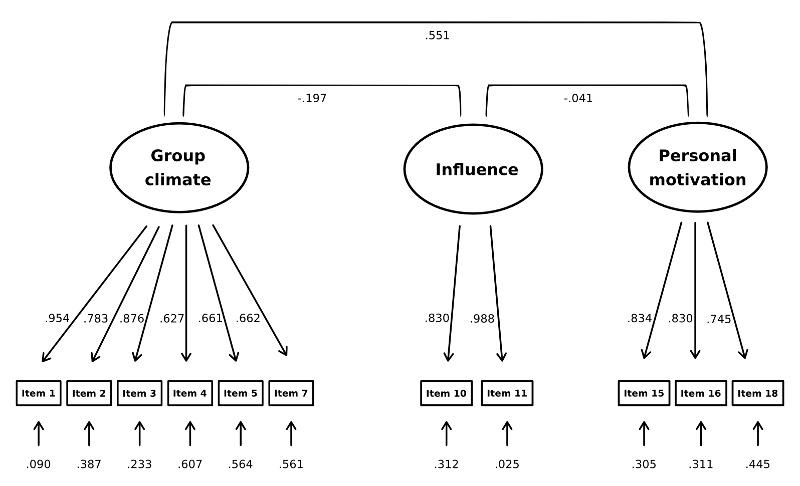
As Table 3 shows, the exploratory factor analysis proposed a three-factor model for the PINCOM-Q items included in the analysis. Derived from the item content, the factors were interpreted and labelled as follows: Factor I: Group Climate (seven items), Factor II: Influence (two items), and Factor III: Personal Motivation (three items).
Confirmatory factor analysis
As shown in the previous section, the exploratory analysis suggested a three-dimensional model representing perceptions of interprofessional collaboration, as measured by 18 PINCOM-Q variables. We then subjected the model to a confirmatory factor analysis (CFA), in which we tested how well the proposed model fitted the data in the second subsample.
Three of the 231 respondents in the subsample were excluded from the analysis because they had not responded to any of the items in question. In the dataset containing the responses of the remaining 228 respondents, eight variables were without missing data, and nine variables contained three or fewer missing entries, while one variable had four missing entries. Missing data were more likely to appear in the second half of the questionnaire, but we did not detect any other patterns in missing data.
In the confirmatory factor analysis, the covariance matrix was analysed using the robust maximum likelihood (MLM) estimation method.
In an initial analysis, we specified the model exactly as proposed by the exploratory factor analysis (EFA), that is, including all items marked by bold print in Table 3. Table 4 shows the model fit indices of this model (see Model A).
Table 4
Fit Indices for the two Proposed Models (A and B)
| Fit index | Model A | Model B |
|---|---|---|
| χ2 | 107.024 (p < .01) | 58.911 (p = .0345) |
| CFI | .956 | .984 |
| TLI | .943 | .979 |
| RMSEA | .071 | .045 |
| RMSEA 90 per cent C.I. | .052, –.090 | .013, –.069 |
| Probability RMSEA ≤ .05 | .033 | .611 |
| SRMR | .053 | .048 |
The modification indices suggested a better model fit might be achieved by permitting correlation between items 7 and 8 (see Table 3). Because no obvious substantial rationale for this correlation was found, we decided to respecify the model by eliminating item 8 from the analysis (on the grounds that this item had the lowest loading on factor I in the EFA).1 This respecification was of minor substantial importance, but it improved model fit indices (see Table 4, Model B). Thus, based on the CFA, we suggested the model in Figure 1 as a conceptualisation of the dimensions in interprofessional collaboration, as perceived by CLCP working committee members.
Index reliability
We computed indices to represent the three constructs. The indices were computed as mean indices; that is, the sum of item values for each respondent was divided by the number of valid items in each index, thereby retaining the same scale metrics as in the questionnaire. Before computing the indices, we reversed the item values for Group Climate and Personal Motivation items. Thus, a high scale value was associated with a positive evaluation for all three scales.
We then investigated the internal consistency reliability of the indices. Table 5 presents the reliability analysis, along with item and scale statistics.
Table 5
Item and Scale Statistics, and Reliability Analysis (Cronbach’s Alpha) Total Sample (N = 467)
| Scale/item | Mean | S.D. | Cronbach’s alpha | Cronbach’s alpha if item deleted |
|---|---|---|---|---|
| Group climate | 5.47 | 1.217 | .90 | |
| Item 1 | 5.50 | 1.472 | .87 | |
| Item 2 | 5.45 | 1.504 | .88 | |
| Item 3 | 5.32 | 1.496 | .88 | |
| Item 4 | 5.75 | 1.487 | .90 | |
| Item 5 | 5.59 | 1.486 | .90 | |
| Item 7 | ||||
| Influence | 4.14 | 1.651 | .91 | |
| Item 10 | 4.24 | 1.735 | – a | |
| Item 11 | 4.05 | 1.698 | – a | |
| Personal motivation | 4.76 | 1.234 | .83 | |
| Item 15 | 4.91 | 1.477 | .75 | |
| Item 16 | 4.74 | 1.469 | .75 | |
| Item 18 | 4.63 | 1.323 | .81 |
As Table 5 shows, internal consistency was satisfactory for all scales, with Cronbach’s alpha ranging from .83 to .91. In addition, the far right column in the table indicates that no gain in Cronbach’s alpha would result from removing items.
Discussion
Perception of interprofessional collaboration in CLCP working committees
The original objective of the shift towards coordinated practices within crime prevention has been to improve communication and partnerships between local municipalities and the police, and in this way to prevent crime through information exchange and early intervention (Gundhus et al., 2008; Holmberg, 2005). Central Norwegian policy documents emphasize that collaboration cultivates the various professions’ uniqueness in competences, hard-core activities, and jurisdictions (see e.g. Norwegian Ministry of Justice, 2009). A main aim is to integrate crime prevention further in social structures and local communities. The idea is that juvenile delinquency is best prevented in the community by multi-agency partnerships between the police, municipal agencies (such as schools and child welfare, leisure, cultural and health facilities), volunteers, and other bodies. A central aim is to facilitate collaboration, managed by a CLCP coordinator. As the views of professionals involved in collaborations may have consequences for outcome success, our aim was to identify the dimensions underlying such views.
Zwarenstein et al. (2009) calls for concepts and measurements relevant for studying issues of interprofessional collaboration, and our results may contribute to this in the sense that they offer psychometrically tested concepts of perceptions of collaboration. The results suggest that CLCP participants’ perceptions of collaboration, as measured in our study, may be represented in three dimensions. This thematic structure was supported by a confirmatory factor analysis, and we found that the data fit the EFA derived model satisfactorily (see Table 4).
The dimension that accounted for the largest proportion of variance in this study was Group Climate. The Group Climate dimension is very similar in content to the social support facet of the Interprofessional Climate dimension described in a previous PINCOM-Q study (Ødegård, 2006). As Dallner (1997) has claimed, the construct of social support may contain several types of support (emotional, instrumental, informational and evaluating). In our study, Dallner’s typology can be traced in the Group Climate dimension. Group Climate denotes appreciation (evaluating), social support (emotional), and quality of communication (informational) in the working committee, as may be seen by the specific items in Table 3. One item (item 4) also suggested that goal-oriented leadership (instrumental) is important in the perception of interprofessional group climate. Because Group Climate was identified as a central aspect of perceiving collaboration, both in the present study and in previous research, it supports the construct validity of this dimension.
What does perception of the Group Climate dimension as a central aspect of perceived interprofessional collaboration in the CLCP working committees indicate? It seems that practitioners involved in the CLCP collaboration share the emphasis Måseide (2008) put on the relational dimension in interprofessional collaboration. Thus, in order to study the processes and outcomes of collaboration efforts, such as the CLCP work, the group climate dimension should be included in further research of collaboration processes.
The second largest dimension, Influence, denotes perceived personal influence in the working committee. As operationalized in the PINCOM-Q instrument, influence means perceived absence of domination by other participants in the collaboration. Perceived influence may be related to professional role and professional and institutional background and it may also be related to the discourse of professional autonomy and borders. A perceived lack of influence may very well stem from how means and ends are defined in the collaborative context, particularly if some participants in the collaboration are seen as having more definitional power than others have. For example, representatives from the police may experience a lack of power if the CLCP work is defined as primary in the social work context, as suggested by Gundhus et al. (2008). Perceived influence, or the lack of it, may thus be an indicator of the degree to which collaboration as a working method have a positive or negative value in the eyes of the participants, as discussed in the introduction. For this reason, we also view influence as an important dimension to consider in collaboration research.
The third dimension, Personal Motivation, denotes participants’ perceptions of personal value, personal goal seeking, and personal growth in committee participation. One can interpret variations in personal motivation in terms of voluntary participation versus delegated functions, and in terms of the degree to which collaboration is seen as personally rewarding, which in turn may be related to the value placed on collaboration within the professions.
Limitations of the study
Given the complexity of team performance (Mathieu et al., 2008), it is obvious that this study does not provide a complete picture of CLCP experiences. First, the study used a relatively new instrument (PINCOM-Q) to investigate perceptions of CLCP collaboration. Although the PINCOM-Q has been promising with regard to reliability and validity measures in previous studies (Rousseau et al., 2012; Ødegård, 2006), we could have employed other scales for exploring interprofessional team functioning. Second, the complexity of team performance requires the use of mixed methods that incorporate both quantitative and qualitative methodologies to capture the multifaceted nature of teamwork (Mathieu et al., 2008; Ødegård & Bjørkly, 2012). For example, it would be interesting to explore CLCP processes, using focus group interviews over time, to understand the development of group climate and possibly its potential impact on crime prevention outcomes. In addition, quantitative studies could be used to investigate whether team diversity affects team outcomes (cf. Horwitz & Horwitz, 2007).
The aim of the present study has been to investigate a model of perceived interprofessional collaboration in crime prevention, and we cannot yet know how actual community crime prevention work is influenced by the quality and strength of these perceptions. Investigating perceptions of interprofessional collaboration can reveal nothing directly about how collaboration processes unfold. However, by acquiring knowledge about the concepts with which professionals perceive collaboration in the CLCP, our investigation may prepare the ground for further investigation into how collaboration processes influence outcomes.
Implications for practice and future research
By providing a conceptual framework the present study may facilitate further developments in interprofessional collaboration. Collaboration practices, such as the CLCP, should consider the three dimensions of perceived interprofessional collaboration in developments of the model, and in evaluations of collaboration work. Collaboration in multi-agency partnerships should consider focusing on ensuring an effective group climate, by emphasizing supportive communication, as well as goal-oriented group leadership. Furthermore, the importance of real influence and being motivated to participate should also be considered. The exclusion of items at the organisational level may have restricted some relevant information about perceptions of interprofessional collaboration in the present study, and this should be taken into account subsequently.
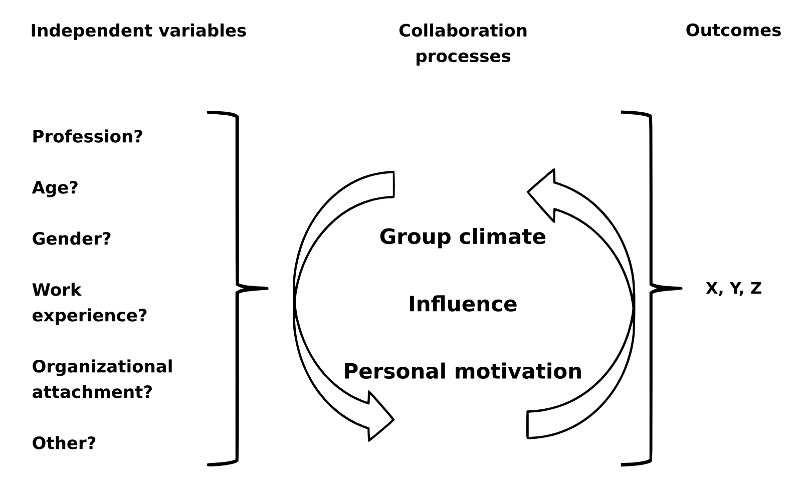
For research purposes, the present study may contribute to fill in the knowledge gap in research on interprofessional collaboration mentioned by Zwarenstein et al. (2009). Our study provides concepts that should be included in studies of interprofessional collaboration, particularly in research aiming to investigate factors that facilitate the collaboration process and influence the outcome of the collaborative efforts. Input–Process–Output models (IPO) are central in the team literature, and the functionality of CLCP in the field of crime prevention may be investigated further within this framework (see figure 2) (Mathieu et al., 2008; Ilgen, Hollenbeck, Johnson & Jundt, 2005). For example, is it possible to identify differences in Group Climate (processes–P) between CLCP working committees and to explore these differences in relation to input variables (I) and outcomes (O)? Examples of possible outcomes might be more effective crime reduction (such as better follow-up of risk groups, leading to a reduction of reports to the police and fewer cases of prosecution in these groups), a rise in the number of preventive efforts, and more production and sharing of knowledge in the CLCP working committees.
Figure 2
Group Climate, Influence, and Personal Motivation—In a Context of Input and Outcome Variables (cf. IPO and IPMO Models (Mathieu et al. (2008))
Finally, in the CLCP context it may be of particular interest to extend the study to an investigation of the role of the co-ordinator. This leadership function seems to be of great importance in CLCP collaboration, and in particular in terms of how perceptions of collaboration are formed. For example, how is group climate developed by CLCP co-ordinators and/or external leaders? In a relatively new review, Mathieu et al. (2008) has presented a broad picture of the complex interaction of factors involved in team effectiveness. For example, it seems obvious that the CLCP co-ordinators have a crucial role in the development of CLCP working committees, because collaborative performance relies on input factors and processes. New studies should also address questions such as whether co-ordinators construe collaboration in a different manner than other CLCP participants, as this could be a possible obstacle to the functioning of interprofessional groups.
Acknowledgements
The authors would like to thank professor Stål Bjørkly, professor Arne Ola Lervåg, and research fellow Kjersti Nesje for valuable comments and advice on earlier drafts of the manuscript.
Appendix.
Appendix 1
Correlation matrix, 18 PINCOM-Q items. Data subset 2 (N=228). Item numbers correspond to item numbering in table 3.
| 1 | 2 | 3 | 4 | 5 | 6 | 7 | 8 | 9 | 10 | 11 | 12 | 13 | 14 | 15 | 16 | 17 | 18 | |
| 1 | 1 | |||||||||||||||||
| 2 | .74** | 1 | ||||||||||||||||
| 3 | .84** | .66** | 1 | |||||||||||||||
| 4 | .59** | .49** | .55** | 1 | ||||||||||||||
| 5 | .63** | .51** | .55** | .49** | 1 | |||||||||||||
| 6 | .76** | .64** | .77** | .46** | .58** | 1 | ||||||||||||
| 7 | .61** | .53** | .61** | .44** | .48** | .63** | 1 | |||||||||||
| 8 | .59** | .53** | .55** | .36** | .52** | .61** | .68** | 1 | ||||||||||
| 9 | .47** | .39** | .44** | .46** | .39** | .45** | .35** | .39** | 1 | |||||||||
| 10 | -.17* | -.20** | -.13 | -.10 | -.08 | -.17** | -.21** | -.18** | -.16* | 1 | ||||||||
| 11 | -.19** | -.20** | -.14* | -.10 | -.06 | -.16* | -.17* | -.15* | -.16* | .81** | 1 | |||||||
| 12 | -.40** | -.36** | -.36** | -.32** | -.33** | -.37** | -.36** | -.32** | -.27** | .61** | .62** | 1 | ||||||
| 13 | -.42** | -.45** | -.41** | -.29** | -.30** | -.36** | -.34** | -.29** | -.23** | .59** | .55** | .74** | 1 | |||||
| 14 | -.47** | -.48** | -.48** | -.39** | -.42** | -.46** | -.49** | -.48** | -.36** | .40** | .37** | .60** | .54** | 1 | ||||
| 15 | .48** | .31** | .48** | .31** | .51** | .57** | .35** | .43** | .41** | -.09 | -.03 | -.26** | -.17** | -.38** | 1 | |||
| 16 | .43** | .26** | .38** | .22** | .51** | .45** | .26** | .40** | .27** | -.10 | -.04 | -.14* | -.10 | -.23** | .70** | 1 | ||
| 17 | .65** | .48** | .57** | .44** | .64** | .59** | .41** | .54** | .51** | -.16* | -.15* | -.35** | -.31** | -.46** | .70** | .72** | 1 | |
| 18 | .38** | .22** | .32** | .24** | .38** | .44** | .26** | .38** | .34** | .02 | .03 | -.10 | -.03 | -.21** | .62** | .64** | .64** | 1 |
| Mean | 2.40 | 2.48 | 2.56 | 2.19 | 2.43 | 2.71 | 2.70 | 2.79 | 2.87 | 4.20 | 4.05 | 4.79 | 4.89 | 5.12 | 3.13 | 3.24 | 2.68 | 3.35 |
| SD | 1.482 | 1.491 | 1.481 | 1.435 | 1.508 | 1.383 | 1.428 | 1.478 | 1.516 | 1.634 | 1.681 | 1.855 | 1.812 | 1.884 | 1.454 | 1.478 | 1.444 | 1.398 |
Notes
References
- Abbott, A. (1988). The system of professions. An essay on the division of expert labor. Chicago: The University of Chicago Press.
- Ahgren, B., & Axelsson, R. (2005). Evaluating integrated health care: a model for measurement. International Journal of Integrated Care, 5(August), 1-12.
- Barr, H., Koppel, I., Reeves, S., Hammick, M., & Freeth, D. (2005). Oxford: Blackwell Publishing. Effective interprofessional education. Argument, assumption and evidence. https://doi.org/10.1002/9780470776445
- Bronstein, L. R. (2002). Index of interdisciplinary collaboration. Social work research, 26(2), 113-126.
- Brown, T. A. (2006). Confirmatory factor analysis for applied research. Chicago: The University of Chicago Press.
- Costello, A. B., & Osborne, J. W. (2005). Best practices in exploratory factor analysis: Four recommendations for getting the most from your analysis. Practical Assessment, Research & Evaluation, 10(7), 1-9.
- Crawford, A. (1998). Crime prevention and community safety: Politics, policies and practices. London: Longman.
- Dallner, M. (1997). Social interactions. In K. Lindstrom, M. Dallner, A. L. Elo, F. Gamberale, S. Knardahl, A. Skogstad, & E. Ørhede (Eds.), Review of Psychological and Social Factors at Work and Suggestions for the General Nordic Questionnaire (QPS Nordic) (pp. 56-59). Copenhagen: Nordic Council of Ministers.
- Deković, M., Slagt, M. I., Asscher, J. J., Eichelsheim, V. I., & Prinzie, P. (2011). Effects of early prevention programs on adult criminal offending: A Meta-Analysis. Clinical Psychology Review, 31(4), 532-544. https://doi.org/10.1016/j.cpr.2010.12.003
- Edwards, A., Daniels, H., Gallagher, T., Leadbetter, J., & Warmington, P. (2009). Improving inter-professional collaborations: Multi-agency working for children’s wellbeing. Oxford: Routledge.
- Fridhov, I. M., & Karlgård, E. (Eds.). (2005). SLT-perm [CLCP manual]. Oslo: Det kriminalitetsforebyggende råd, Justis- og politidepartementet.
- Gilling, D. (2005). Partnership and crime prevention. In N. Tilley (Ed.), Handbook of crime prevention and community safety (pp. 734-756). Cullompton: Willan Publishing.
- Gundhus, H. I., Egge, M., Strype, J., & Myhrer T.-G. (2008). Modell for forebygging av kriminalitet? Evaluering av Samordning av lokale kriminalitetsforebyggende tiltak (SLT) [A model for prevention of crime? Evaluation of the co-ordination of local crime preventive enterprises model (CLCP)]. PHS Forskning 2008:4. Oslo: Norwegian Police University College. http://hdl.handle.net/11250/175055
- Hoe, S. L. (2008). Issues and procedures in adopting structural equation modeling technique. Journal of Applied Quantitative Methods, 3(1), 76-83.
- Holmberg, L. (2005). Policing and the feeling of safety: The rise (and fall?) of community policing in the Nordic countries. Journal of Scandinavian Studies in Criminology and Crime Prevention, 5(2), 205-219. https://doi.org/10.1080/14043850410010702
- Horwitz, S. K., & Horwitz, I. B. (2007). The effects of team diversity on team outcomes: A meta-analytic review of team demography. Journal of Management, 33(6), 987-1015. https://doi.org/10.1177/0149206307308587
- Hughes, G. (2007). The politics of crime and community. New York: Palgrave Macmillan.
- Ilgen, D. R., Hollenbeck, J. R., Johnson, M., & Jundt, D. (2005). Teams in organizations: From input-process-output models to IMOI models. Annual Review of Psychology, 56, 517-543. https://doi.org/10.1146/annurev.psych.56.091103.070250
- Jackson, D. A. (1993). Stopping rules in principal components analysis: A comparison of heuristical and statistical approaches. Ecology, 74(8), 2204-2214.
- Kenaszchuk, C., Reeves, S., Nicholas, D., & Zwarenstein, M. (2010). Validity and reliability of a multiple-group measurement scale for interprofessional collaboration. BMC Health Services Research, 10. https://doi.org/10.1186/1472-6963-10-83
- Kenny, D.A. (2012). Measuring model fit. Retrieved from: http://davidakenny.net/cm/fit.htm
- Leathard, A. (2003). Interprofessional collaboration: From policy to practice in health and social care. Hove and New York: Brunner-Routledge. https://doi.org/10.4324/9780203420690
- Lindqvist, S., Duncan, A., Shepstone, L., Watts, F., & Pearce, S. (2005). Development of the Attitudes to Health Professionals questionnaire (AHPQ): A measure to assess interprofessional attitudes. Journal of Interprofessional Care, 19(3), 269-279. https://doi.org/10.1080/13561820400026071
- Mathieu, J., Maynard, M. T., Rapp, T., & Gilson, L. (2008). Team effectiveness 1997-2007: A review of recent advancements and a glimpse into the future. Journal of Management, 34(3), 410-476. https://doi.org/10.1177/0149206308316061
- McFadyen, A. K., Webster, V., Strachan, K., Figgins, E., Brown, H., & McKechnie, J. (2005). The readiness for interprofessional learning scale: A possible more stable sub-scale for the original version of RIPLS. Journal of Interprofessional Care, 19(6), 595-603. https://doi.org/10.1080/13561820500430157
- Måseide, P. (2008). Profesjonar i eit interaksjonsteoretisk perspektiv [Professions in an interaction theory perspective]. In A. Molander & L. I. Terum (Eds.), Profesjonsstudier (pp. 367-385). Oslo: Universitetsforlaget.
- Norwegian Ministry of Justice (2009). Regjeringens strategi for forebygging. Fellesskap – trygghet – utjevning. [The Government’s Strategy for Prevention. Community – Safety – Equalization]. Oslo: Justis- og politidepartementet.
- Norwegian Police Directorate (2005). Politiet i lokalsamfunnet: Veileder om politiets kommunikasjon og samhandling med kommuner og andre aktører på lokalt og regional nivå [The police in the local community: A guide to police communication and interaction with municipalities and other operators on the local and regional levels]. Oslo: Norwegian Police Directorate (12/2005).
- Pedhazur, E. J., & Schmelkin, L. P. (1991). Measurement, design and analysis. Hillsdale, N.J.: Lawrence Erlbaum Associates. Hillsdale, N.J.: Lawrence Erlbaum Associates.
- Pihl, J. (2011). Literacy education and interprofessional collaboration. Professions and professionalism, 1(1), 52-66. https://doi.org/10.7577/pp.v1i1.149
- Pihl, J. (2009). Interprofessional cooperation between teachers and librarians: analysing theoretical and professional arguments for cooperation in an era of globalization. In H. B. Holmarsdottir & M. O’Dowd (Eds.), Nordic voices: Teaching and researching comparative and international education in the Nordic countries (pp. 39-57). Rotterdam: Sense.
- Reeves, S., Zwarenstein, M., Goldman, J., Barr, H., Freeth, D., Koppel, I., & Hammick, M. (2010). The effectiveness of interprofessional education: key findings from a new systematic review. Journal of Interprofessional Care, 24(3), 230-41. https://doi.org/10.3109/13561820903163405
- Reise, S. P., Waller, N. G., & Comrey, A. L. (2000). Factor analysis and scale revision. Psychological Assessment, 12(3), 287-297. https://doi.org/10.1037/1040-3590.12.3.287
- Rousseau, C., Laurin-Lamothe, A., Nadeau, L., Deshaies, S., & Measham, T. (2012). Measuring the quality of interprofessional collaboration in child mental health collaborative care. International Journal of Integrated Care., Published online Feb.10, 2012. Retrieved from:. http://www.ncbi.nlm.nih.gov/pmc/articles/PMC3287319/
- Thannhauser, J., Russell-Mayhew, S., & Scott, C. (2010). Measures of interprofessional education and collaboration. Journal of Interprofessional Care, 24(4), 336-49. https://doi.org/10.3109/13561820903442903
- Zwarenstein, M., Goldman, J., & Reeves, S. (2009). Interprofessional collaboration: effects of practice-based interventions on professional practice and healthcare outcomes. Cochrane Database of Systematic Reviews, 3. https://doi.org/10.1002/14651858.CD000072.pub2
- Ødegård, A. (2006). Exploring perceptions of interprofessional collaboration in child mental health care. International Journal of Integrated Care, 6(4), 1-13.
- Ødegård, A., & Bjørkly, S. (2012). A mixed method approach to clarify the construct validity of interprofessional collaboration – An empirical research illustration. Journal of Interprofessional Care, 26(4), 283-288. https://doi.org/10.3109/13561820.2011.652784
- Ødegård, A., & Strype, J. (2009). Perceptions of interprofessional collaboration within child mental health care in Norway. Journal of Interprofessional Care, 23(3), 286-296. https://doi.org/10.1080/13561820902739981
- Ødegård, A., Hagtvet, K., & Bjørkly, S. (2008). Applying aspects of generalizability theory in preliminary validation of the multifacet interprofessional collaboration model (PINCOM). International Journal of Integrated Care, 8, 1-11.