Tampere Research Center for Information and media, School of Information Sciences
University of Tampere
Email: antti.syvanen@uta.fi
The Research and Education Centre Synergos, School of Management
University of Tampere
Email: jaana-piia.makiniemi@uta.fi
The Research and Education Centre Synergos, School of Management
University of Tampere
Email: sannu.syrja@uta.fi
The Research and Education Centre Synergos, School of Management
University of Tampere
Email: kirsi.heikkila-tammi@uta.fi
Tampere Research Center for Information and media, School of Information Sciences
University of Tampere
Email: jarmo.viteli@uta.fi
The accelerating digitalization of society has resulted in a demand to speed-up the implementation of ICT in teaching, and changes in curriculum policies reflect this development. However, the demand to increase the educational use of ICT may also cause stress. The aim of the current study was to explore how demographics are associated with technostress and which factors predict it in Finnish school teachers. The data was collected with the OPEKA online self‑evaluation questionnaire tool. The sample consisted of 2,741 teachers. The results indicated that subject teachers were more “technostressed” than class teachers, female teachers were more stressed than males, and teachers with 16–30 years of working experience were more stressed than teachers with 0–15 years of experience. The key predictors of the technostress were ICT competence, the concordance of the educational use of ICT with the teaching style, school support, and attitudes to the educational use of ICT. High ICT competence, high concordance of ICT with the teaching style, high levels of school support, and positive attitudes to ICT were associated with low levels of technostress. The results are discussed in the light of previous findings, and the practical implications and the need for future studies are explored.
Keywords: teachers, technostress, educational use of ICT, competence, teaching style
The constantly increasing use of ICT at work has become emphasized in the ongoing reform of the preschool and comprehensive school curricula in Finland. For instance, ICT competence is mentioned as a one of the broad-based competencies, and a computer programming course has been introduced in a curriculum starting in 2016 (Vahtivuori-Hänninen, Halinen, Niemi, Lavonen, & Lipponen, 2014). The central aim of the curriculum reform is to develop the school culture and to promote instruction with an integrative approach – namely to support the development of pupils’ transversal competencies, such as: 1) “thinking and learning-to-learn”; 2) “cultural competence, interaction and expression”; 3) “taking care of oneself, managing daily life”; 4) “multiliteracy”; 5) “ICT competence”; 6) “working life competence and entrepreneurship”; and 7) “participation, involvement and building a sustainable future” (Finnish National Board of Education, 2016).
The digitalization of education can also be stressful for teachers. There might be various reasons for such technostress. First of all, the digitalization of work often creates a demand to learn new things and adopt new technologies, which requires extra effort and may lead to higher workload and time pressures. Thus, stress can also be seen as an indicator of learning. The digitalization of work might also force the teacher to change the way she or he works. (Tarafdar, Tu, Ragu-Nathan, & Ragu‑Nathan, 2011; Tarafdar, D’Arcy, Turel, & Gupta, 2015.) Furthermore, technostress might appear in situations where the teacher feels the compulsion to increase the educational use of ICT even though it contradicts with her/his personal teaching preferences. For example, the teacher might feel that the bring‑your‑own‑device culture places students in an unequal position according to their ownership of devices, since this is contrary to the core value of equality in the Finnish school system. Consequently, the teacher may feel a diminished sense of job control and agency.
Therefore, the aim of the study is to measure which factors are associated with perceived technostress among Finnish teachers:
Technostress refers to stress experienced by individuals due to the use of technology. It arises, for example, in situations where the technology used is too complicated, changes rapidly, and/or involves the demand for multitasking (Ragu-Nathan, Tarafdar, Ragu-Nathan, & Tu, 2008). Technostress appears as a negative psychological state or experience, and can manifest as feelings of anxiety, fatigue, scepticism, and inefficiency (Hudiburg, 1989; Salanova, Llorens, & Cifre, 2013).
We consider teachers’ technostress a relevant topic due to the intensity of the integration of new technologies into teaching. Furthermore, technostress seems to influence teachers’ intentions to use technology (Joo, Lim & Kim, 2016), and, in general, high levels of technostress are found to be associated with lower job satisfaction and job performance, and even with intentions to quit (see Tarafdar, Pullins, & Ragu-Nathan, 2015 for review). In addition, stress symptoms may also appear at the interpersonal level – for example, as conflicts or aggression. Thus, technostress symptoms may lead to a poorer quality of social interaction between the teacher and pupils, and consequently to poorer learning. Moreover, there are only few studies focusing on teachers’ technostress (Al-Fudail & Mellar, 2008; Lim 2012; Joo et al., 2016), since studies on technostress are primarily focused on knowledge workers. It has been pointed out that there is a need for studies focusing on specific contexts (Tarafdar et al., 2015). In line with this, we assume that there can be special aspects associated with teachers’ technostress, because the levels and sources of work stress differ between professions (Johnson, Cooper, Cartwright, Donald, Taylor, & Millet, 2005).
Previous findings indicate that teachers are exhibiting technostress symptoms (Lim, 2012), mainly due to usability problems, a lack of technological and social support, the need to train less skilled pupils, the extra time and effort needed to integrate technology, and a lack of training in the use of technologies (Al-Fudail & Mellar, 2008). In addition, it has been shown that Technological Pedagogical Content Knowledge (TPACK) (i.e. the teacher’s ability to combine content, pedagogy, and technology meaningfully in teaching) and school support are associated with teachers’ technostress: high TPACK and a high level of school support are associated with lower levels of technostress (Joo et al., 2016).
There is demographic variation in the experience of technostress. For example, it is often intuitively assumed that older employees experience higher levels of technostress than younger ones, since it is assumed that younger employees are more familiar with novel technologies. However, some empirical findings suggest that older employees experience less technostress (e.g. Ragu-Nathan et al., 2008; Tarafdar et al., 2011). Older employees might be better able to handle work stress in general, and since they have faced more work‑related changes, they are more able to cope with them (cf. Tarafdar et al., 2011). Usually, older employees are more experienced, and consequently have higher levels of know-how and better job control (i.e. competence), which are associated with well‑being at work (Bakker & Demerouti, 2007). It has also been suggested that females experience more technostress. This is often justified by findings indicating that women tend to have higher computer anxiety (e.g. Durndell & Haag, 2002; Ong & Lai, 2006). However, there are findings that suggest males experience a higher level of technostress (e.g. Ragu-Nathan et al., 2008) and others that suggest gender has no effect on anxiety (Shah, Hassan, & Embi, 2012). These findings might relate to the fact that job‑related factors – such as work autonomy – may influence technostress more than demographics (cf. Ragu-Nathan et al., 2008; Tarafdar et al., 2011). This is in line with the notions that job resources and demands have an influence on well‑being at work (Bakker & Demerouti, 2007). In Pareto and Willermark’s study (2014), Swedish primary school teachers stated that a fragmented work environment and high working‑day tempo diminished their willingness to adopt technologies.
In the current study, we explore how working years, gender, school type, and teacher type are related to technostress, since they are relevant factors in this context. For example, the latest Finnish research report indicated that classroom teachers (who teach grades 1–6) were more competent in using digital learning materials, while subject teachers (who teach grades 7–12) were more competent in using learning environments for communication and using students’ personal mobile devices in curricula. Classroom teachers also considered it less burdensome (i.e. stressful) to bring new technology into teaching than subject teachers (Tanhua-Piiroinen, Viteli, Syvänen, Vuorio, Hintikka, & Sairanen, 2016).
There are various factors associated with technostress. Technostress inhibitors are those factors which decrease the amount of technostress, whereas creators increase it. For instance, technical support and training are key inhibitors, whereas multitasking is a creator of technostress. (Tarafdar et al., 2011) Below, we present five factors that might be associated with teachers’ technostress: ICT competence, attitude to the educational use of ICT, concordance of ICT with the teaching style, level of school support, and frequency of ICT educational.
According to the job demands-resources (JD-R) model, every job contains demands (e.g. workload) that threaten employee well‑being, as well as resources (e.g. autonomy) that enhance well‑being (Bakker & Demerouti, 2007). For example, competence (e.g. variability in professional skills) is a job resource that has been shown to be able to maintain employee well‑being (e.g. work engagement) in stressful work situations (Hakanen, Bakker, & Demerouti, 2005; Bakker & Demerouti, 2007). Thus, workers with good ICT competence do not necessarily feel “technostressed” even though there is a high demand (e.g. reform) to adopt new technologies, since their competence acts as a protective resource. On the other hand, it is proposed in Karasek’s (1979) demand-control model (DCM) that low job control is associated with stress, especially when high job demands occur simultaneously (see also Van der Doef & Maes, 1999 for review). According to Karasek (1979), the opportunity to make decisions and exercise judgement during the workday enhances the individual’s feelings of efficacy and coping.
In line with these theories, high computer confidence is empirically shown to be associated with lower levels of technostress (Tarafdar et al., 2011), and one reason for a reluctance to integrate technology into teaching is shown to be a lack of technical competence (Ryan & Deci, 2000; Tallvid, 2014). Teachers with the ability to integrate technology meaningfully into their teaching seem to cope better with technostress (Joo et al., 2016). Based on these findings, we suppose that high ICT competence is associated with a lower level of technostress.
Computer attitude scales incorporating items on computer anxiety (e.g. Loyd & Gressard, 1984) have been in extensive use in technology adoption research. The concept of computer anxiety shares similarities with the concept of technostrain: both involve experiences of anxiety and fatigue, for example (cf. Salanova et al., 2013). In a study on computer anxiety and attitudes among secondary school teachers in Malaysia, it was found that lower computer anxiety related to positive attitudes towards computers (Hong & Koh, 2002). Based on these findings, we hypothesize that a positive attitude to ICT is associated with a lower level of technostress.
It is stated that the teacher’s beliefs can act as a “second-order” barrier to the integration of ICT in teaching (Ertmer, Ottenbreit-Leftwich, Sadik, Sendurur, & Sendurur, 2012). The act of teaching is a moral one in that it is based on the mastery of subject matter knowledge, the curriculum, and pedagogical methods (see e.g. Campbell, 2008), making the individual teacher’s beliefs, attitudes, and values significant aspects of the profession. It seems teachers are more likely to adopt (the kind of) practices with computers that reflect their beliefs about teaching (Drenoyianni & Selwood, 1998). To illustrate this point, those teachers who believe that technology can support collaboration teach projects in which technology is used for collaboration (Ertmer et al., 2012). Furthermore, Tallvid (2014) found that if secondary school teachers did not think that integrating laptops into their classes enhanced the pedagogical element of their teaching, they were reluctant to use them, which is in line with the body of research suggesting that the perceived usefulness of ICT is one of the key determinants of the actual use of ICT in classroom (for a review, see Scherer, Siddiq, & Teo, 2015).
Thus, previous findings support the idea that teaching beliefs are associated with the educational use of ICT. There is a general lack of knowledge on how teaching beliefs and technostress are related, but Joo et al. (2016) found high levels of TPACK to be associated with lower levels of technostress. We suggest that there might be a connection between teaching style and technostress, since teachers may experience a conflict between the demand for the educational use of ICT and their pedagogical knowledge, teaching style, and value-based didactic thinking. Consequently, teachers do not necessarily think that integrating more ICT is a good way to teach. This is in line with the notion that technostress is higher among those who do not consider the technological solution to be the best possible option when performing tasks (Tarafdar et al., 2011). We therefore hypothesize that a higher concordance of ICT with the teacher’s teaching style is negatively connected to technostress: the more one feels that ICT fits one’s style of teaching, the less one experiences technostress.
Empirical evidence suggests, for example, that help desks, end-user training, and user participation are good ways to reduce technostress in organizations (Fuglseth & Sørebø, 2014). In line with this, the lack of social support (e.g. from other teachers or IT support) needed to use technology in teaching has been shown to be one creator of teachers’ technostress (Al-Fudail & Mellar, 2008). It is worth noting that Finnish schools differ remarkably from organizations that have separate IT departments to enhance the adoption and use of technology at work. What local school support often means in practice is that one of the teachers takes the responsibility to maintain the school’s ICT. Based on previous findings, we hypothesize that low school support is associated with higher levels of technostress.
It has been shown that technostress can influence the intention to use technology (Joo et al., 2016), but evidently using technology is one of the key sources of technostress ( cf. Lim, 2012). It seems that experiences of technostrain are characterized by excessive and compulsive use of ICT (Salanova et al., 2013), indicating that the way the technology is used might be stressful. Moreover, adopting and using especially novel technologies often requires extra effort and increases work load. In addition, dividing one’s attention between the technology and interaction with students might be challenging, especially when technological problems occur simultaneously. This kind of extensive multitasking is shown to be associated with higher levels of technostress (cf. Tarafdar et al., 2011). Together, these findings suggest that using technology is a kind of prerequisite for technostress. However, the relationship between the frequency of the use of ICT and technostress might be more complex and moderated by other factors, such as competence. Potentially there are at least three associations between frequency of ICT use, technostress, and competence. First of all, frequent user experience may support the development of ICT competence, which in turn may decrease the feeling of technostress (cf. Tarafdar et al., 2011). In this case, competence can protect from technostress (cf. Bakker & Demerouti, 2007; Hakanen et al., 2005). Secondly, high frequency of use may be related to higher levels of technostress, especially when combined with low ICT competence due to diminished job control, for example (cf. Karasek, 1979). In addition, when technology is used intensively, more stressful technological problems may occur, which is often related to technostress (cf. Tarafdar et al., 2011). Thirdly, we assume that in some cases, the high frequency of use may be negatively associated with technostress, even though the teacher’s competence is moderate or low. For instance, in the case of enthusiastic teachers who are less skilled but willing to integrate technology, their inspiration might act as a resource that protects them from technostress (cf. Bakker & Demerouti, 2007).
Based on the previous studies, we hypothesize that the frequency of ICT use is associated with technostress, but it is not clear what kind of association there might be.
The data was collected with the OPEKA online self-evaluation questionnaire tool for ICT usage in teaching. The respondents answered the questionnaire between 1 November 2015 and 30 January 2016. OPEKA is an online survey tool for teachers and principals; it gives the individual teacher immediate feedback on her/his use of ICT in education, provides the principals and school communities with information on how their school is doing in terms of ICT usage, and is useful for developers, decision‑makers, and politicians at the town, municipal, or national level. The tool can become an integral part of the development cycle of the municipality or school (Sairanen, Vuorinen, & Viteli, 2013).
OPEKA is built around the idea of a learning technology ecosystem and it utilizes the theoretical foundation of the ecosystem metaphor as introduced by Zhao and Frank (2003). Some parts of the OPEKA survey are adopted from pre-existing scales, such as TPACK. Various validation and testing processes are taken as described in more detailed in Sairanen, Vuorinen, and Viteli (2013); Sairanen, Viteli, and Vuorinen (2013); and Viteli (2013). OPEKA has been used to study the basic usage of ICT in Finnish schools (Sairanen et al., 2013), to investigate what kind of software and devices produce more usage in schools (Viteli, 2013), and to determine the current status of national educational ICT adoption in basic education (Tanhua-Piiroinen et al., 2016).
A total of 1,103 subject teachers and 1,638 classroom teachers participated in the survey, consisting of 2,017 female and 677 male respondents. The median number of working years was 15 and the average age was 44.66 (SD = 9.49).
The OPEKA survey consists of a total of 106 items related to the digital learning culture, devices, and software and ICT competence. Only the items related to the topic of the current study – such as technostress, ICT competence, attitude to ICT, concordance of ICT with the teaching style, school support for ICT, and frequency of use – were integrated into the study.
The demographic items were gender, working years, school type (primary, lower secondary, comprehensive), and teacher type (class, subject).
Technostress was measured with the item “Constantly bringing new technology to teaching is burdensome/stressful.” The respondents were asked to indicate how strongly they agree with the statement. The range was from 1 = Strongly disagree to 5 = Strongly agree.
ICT competence was measured with four items: “I know how to utilize digital teaching materials in my teaching”, “I know how to utilize students’ own mobile devices as a part of learning”, “Utilizing information and communication technology (ICT) according to the curriculum is difficult [Reversed]”, and “I find good ways to utilize ICT in various learning situations”. The respondents were asked to indicate how strongly they agree with the statements. The range was from 1 = Strongly disagree to 5 = Strongly agree.
Attitude to ICT was measured with the item “I would like to use ICT more in my teaching”. The respondents were asked to indicate how strongly they agree with the statement. The range was from 1 = Strongly disagree to 5 = Strongly agree.
The concordance of ICT with the teaching style was measured with the Item “ICT fits my style of teaching”. The respondents were asked to indicate how strongly they agree with the statement. The range was from 1 = Strongly disagree to 5 = Strongly agree.
School support for ICT was measured with eight items: “My school supports me in taking part in ICT training”, “I get sufficient technical support with sufficient speed for ICT usage in my school”, “Opportunities are arranged for sharing pedagogical tips on ICT usage in our work community”, “I feel I am lonely when developing the pedagogical use of ICT [Reversed]”, “Our school has a jointly agreed goal for utilizing ICT in teaching”, “In my school, it is easy to start developing new procedures”, “I get support and tips from my colleagues on how to use ICT in my teaching”, and “Our work community atmosphere is positive towards trying new things in teaching”. The respondents were asked to indicate how strongly they agree with the statement. The range was from 1 = Strongly disagree to 5 = Strongly agree.
Frequency of ICT use was measured with one question: “How often do you use ICT in your teaching?” The scale ranged from 1 = Never to 5 = Daily.
The data was analysed with IBM SPSS 22. Prior to the main analysis, an exploratory factor analysis using the Maximum Likelihood Method with orthogonal Varimax rotation was performed to measure the dimensionality of the ICT competence and School support scales. The results of the factor analysis, as well as Cronbach’s alphas (see Table 1) supported the one‑dimensional solutions. The mean scores were calculated. The independent samples t-test was used to detect differences in technostress between class and subject teachers and between males and females. The analysis of variance was used to detect differences in technostress between teachers who were divided into three different groups by their number of working years. Hierarchical regression analysis was used to test which variables predict technostress after controlling for the effect of demographics. As an additional analysis, a simple slope method by Aiken and West (1991) based on the moderated regression coefficient was performed to measure the interaction effect.
Means, standard deviations, Cronbach’s alphas, and correlations for all the main variables are presented in Table 1. In relation to technostress, ICT competence had the strongest correlation, followed by concordance of ICT with the teaching style, frequency of ICT use, school support for ICT, and attitude to ICT. More precisely, low ICT competence, low concordance of ICT with the teaching style, low frequency of ICT use, poor school support for ICT use, and negative attitudes towards ICT were statistically significantly related to higher levels of technostress.
|
Variable |
Range |
M |
SD |
α |
1 |
2 |
3 |
4 |
5 |
|
1: Technostress |
1–5 |
3.19 |
1.1 |
||||||
|
2: ICT Competence |
1–5 |
3.48 |
0.73 |
0.78 |
-.43** |
||||
|
3: Attitude to ICT |
1–5 |
3.96 |
0.86 |
-.16** |
.07** |
||||
|
4: Concordance of ICT with the teaching style |
1–5 |
3.78 |
0.89 |
-.39** |
.55** |
.38** |
|||
|
5: School support for ICT |
1–5 |
3.58 |
0.59 |
0.70 |
-.20** |
.31** |
.03 |
.18** |
|
|
6: Frequency of ICT use |
1–5 |
4.11 |
0.82 |
-.25** |
.45** |
.12** |
.45** |
.19** |
|
|
*p < .05. |
|||||||||
|
**p < .01. |
|||||||||
|
***p < .001. |
Table 1: Means, standard deviations, and correlation coefficients of the main variables.
Teacher type
There were statistically significant differences between class (M = 3.14, SD = 1.11) and subject teachers (M = 3.25, SD = 1.09) in the mean scores for technostress (t(2,697) = 2.518, p = .012). This means that subject teachers felt more technostress than class teachers.
Additional analysis indicated statistically significant differences in attitudes to ICT (p <. 01; class teachers more positive), ICT competence (p < .01; subject teachers were more competent), concordance of ICT with the teaching style (p < .01; ICT better fits class the teachers’ teaching style), school support for ICT (p < .01, class teachers receive better support), and frequency of ICT use (p < .01; class teachers used ICT more frequently).
School type
There were statistically significant differences in the mean levels of technostress between the teachers working in different types of schools (F(2, 2,696) = 4.186, p = .015). The Tukey HSD post-hoc comparison indicated that teachers in primary schools (M = 3.15, SD = 1.11) experienced statistically significantly less technostress than teachers in lower secondary schools (M = 3.28, SD = 1.08, p = .017). This means that the primary school teachers, who are mostly class teachers, experienced less technostress than subject teachers in lower secondary schools – although not in comparison to the teachers in comprehensive schools with primary and lower secondary education.
Additional analysis indicated statistically significant differences in ICT competence (p < .01; comprehensive school teachers more competent than primary and lower secondary school teachers), concordance of ICT with the teaching style (p<.05; ICT has a better fit with the teaching style of primary school teachers than lower secondary school teachers), attitude to ICT (p < .01; primary school teachers have a more positive attitude to ICT than lower secondary school teachers), and school support for ICT (p < .01; primary school teachers have better school support for ICT than lower secondary school teachers). There were no statistically significant differences in the frequency of ICT use between teachers working in the different types of schools.
Working years
There were statistically significant differences in the mean levels of technostress between the working experience groups (F(2, 2,685) = 6.767, p = .001). The Tukey HSD post-hoc comparison indicated that teachers with 0–15 years of working experience (M = 3.11, SD = 1.10) experienced statistically significantly less technostress than teachers with 16–30 years of working experience (M = 3.26, SD = 1.08, p = . 003). This means that the youngest group of teachers experienced less technostress than more experienced teachers, although more in comparison to the most experienced group of teachers (31–45 years of working experience).
Additional analysis indicated statistically significant differences in ICT competence (p < .01; younger teachers more competent), concordance of ICT with the teaching style (p < .01; ICT has a better fit with younger teachers’ teaching style), and frequency of ICT use (p < .01; younger teachers use ICT more frequently). There were no statistically significant differences between the working years groups in attitude to ICT or school support for ICT.
Gender
There were statistically significant differences between male (M = 3.11, SD = 1.176) and female (M = 3.21, SD = 1.075) teachers in perceived technostress (t(1,057.805) = 2.032, p = .042). This means that the female teachers experienced less technostress than male teachers.
Additional analysis also indicated statistically significant differences in attitudes towards ICT (p < .01; female teachers more positive) and ICT competence (p < .01; male teachers more competent). There were no statistically significant differences between male and female teachers in concordance of ICT with the teaching style, school support for ICT, and frequency of ICT use.
Predicting perceived technostress
Hierarchical regression analysis was used to assess the ability of the five main factors to predict perceived technostress after controlling for the effect of demographic variables (gender, school category, teacher type, working years). Demographic variables were entered at Step 1, but they explained only 1% of the variance in perceived technostress (see Table 2). After the entry of the predictors at Step 2, the total variance explained by the model as a whole was 23 % (F(9, 2,456) = 81.40, p < .001). So, the predictors explained an additional 22% of the variance in perceived technostress, after controlling for demographic variables (R2-change = .22, FChange (5, 2,456) = 140.31, p <. 001). Attitude to ICT, concordance of ICT with the teaching style, school support for ICT, and ICT competence were statistically significant predictors in the final model. In other words, high levels of ICT competence, high concordance of ICT with the teaching style, high levels of school support, and positive attitudes were associated with low levels of technostress.
|
Variable |
B |
SE B |
β |
R² |
|
Step 1 |
||||
|
Gender |
-0.12 |
0.05 |
-.05* |
|
|
School type |
-0.03 |
0.04 |
-.02 |
|
|
Teacher type |
-0.15 |
0.06 |
-.07** |
|
|
Working years |
0.13 |
0.04 |
.07*** |
|
|
.01*** |
||||
|
Step 2 |
||||
|
Gender |
-0.03 |
0.05 |
-.01 |
|
|
School type |
-0.01 |
0.04 |
.00 |
|
|
Teacher type |
-0.07 |
0.05 |
-.03 |
|
|
Working years |
-0.04 |
0.03 |
-.02 |
|
|
Attitude to ICT |
-0.08 |
0.03 |
-.06** |
|
|
Concordance of ICT with the teaching style |
-0.24 |
0.03 |
-.19*** |
|
|
Frequency of ICT use |
-0.01 |
0.03 |
-.01 |
&nnbsp; |
|
School support for ICT |
-0.13 |
0.04 |
-.07*** |
|
|
ICT competence |
-0.45 |
0.04 |
-.30*** |
|
|
.23*** |
||||
|
*p < .05. |
||||
|
**p < .01. |
||||
|
***p < .001. |
Table 2: Summary of hierarchical regression analysis for variables predicting perceived technostress.
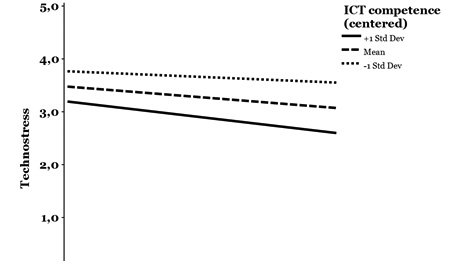
Since frequency of use was not associated with technostress, we conducted an additional analysis to measure whether there was an interaction effect between frequency of use and ICT competence –namely, whether competence moderates the effect of frequency of use on technostress. Frequency of use and ICT competence were entered in the first step of the hierarchical regression analysis. In the second step, the interaction term between frequency of ICT and ICT competence was entered. The interaction terms explained a significant increase in variance in technostress (ΔR2 = .18, F(3, 3,237) = 245.13, p < .00). Simple slopes (Aiken & West, 1991) for the association between frequency of use and technostress were tested for low (-1 SD below the mean), moderate (mean), and high (+1 SD above the mean) ICT competence. The simple slope tests revealed a significant negative association between frequency of use and technostress for higher ICT competence (b = -.12, SEb = .03, β = -.09, p < .05) and moderate ICT competence (b = -.04, SEb = .02, β = -.14, p < .05). No significant association was found between frequency of use and technostress for lower ICT competence. So, the frequency of using ICT in teaching was associated with lower levels of technostress when competence was high or moderate but not when competence was low.
Figure 1. Simple slopes of frequency of use predicting technostress for 1 SD below the mean of ICT competence, the mean of ICT competence, and 1 SD above the mean of ICT competence.
The aim of the current study was to explore how demographic factors are associated with and predict technostress among Finnish teachers. Based on the previous studies, it was suggested that low ICT competence, negative attitudes to ICT, low concordance of ICT with the teaching style, and poor school support are associated with higher levels of technostress (e.g. Al-Fudail & Mellar, 2008; Hong & Koh, 2000; Joo et al., 2016). As assumed, based on the analysis of correlations, lower ICT competence, lower concordance of ICT with the teaching style, lower frequency of ICT use, poor school support for ICT use, and negative attitudes towards ICT were statistically significantly related to higher levels of technostress.
In line with the previous studies, our findings indicated a demographic variation in technostress. Subject teachers experienced more technostress than class teachers, female teachers were more stressed than males, and teachers with 16–30 years of working experience were more stressed than teachers with 0–15 years of experience. There were no differences between school types. Thus, our findings supported the view that there is demographic variation in technostress (e.g. Tarafdar et al., 2011), and that females experience more technostress than males (Durndell & Haag, 2002; Ong & Lai, 2006).
The results also indicated that teacher type is a relevant factor: the subject teachers experienced more technostress than class teachers. An identical pattern was found by Tanhua-Piiroinen et al. (2016) as well. The differences between the teacher types may relate to the somewhat different teaching context (7–12‑year-old pupils for classroom teachers vs 12–15‑year‑old pupils for subject teachers) with different curricular requirements. However, it is not totally clear how different teaching contexts influence technostress. For instance, teenagers might be more challenging students, which makes work more stressful. The nature and length of pre-service education of classroom and subject teachers (five years vs one year of training, respectively) differ and may lead to different teaching beliefs and practices.
However, it is worth noting that although there were some demographic variations in technostress, based on the hierarchical regression analysis, demographic variables explained only one per cent of the variance. This supports the notion that job‑related factors may influence technostress more than demographics (cf. Ragu-Nathan et al., 2008; Tarafdar et al., 2011), and that also “general” job‑related factors, such as demands and resources, are associated with technostress. Therefore, it would be wise to integrate more comprehensively those job factors that are shown to be related to employee well‑being in general into technostress studies (cf. Bakker & Demerouti, 2007). To achieve this, the adoption of more holistic theoretical approaches to technostress would be useful (e.g. Fischer & Riedl, 2015).
The results of the hierarchical regression analysis indicated that the key predictors of technostress were, in descending order of importance, ICT competence, concordance of ICT with the teaching style, school support, and attitude to ICT. In practice, these findings suggest that those teachers who have good ICT competence, a teaching style that in concord with the educational use of ICT, a positive attitude to the educational use of ICT, and who receive support have the lowest levels of technostress. The findings are in line with previous ones, indicating that school support (Joo et al., 2016), ICT competence (Tarafdar et al., 2011), positive attitudes (Hong & Koh, 2002) and teaching style (Joo et al., 2016) are key factors associated with technostress. In addition, our results support the previous findings suggesting that the most common sources of technostress among Turkish teachers were lack of education (cf. competence) and lack of interest (cf. attitude; Çoklar, Efilti, Sahin, & Akçay, 2015).
Unexpectedly, the frequency of use of ICT in teaching was not a significant predictor of technostress. Therefore, we repeated the analysis with the competence*frequency-interaction term. The analysis indicated an interaction: the frequency of using ICT in teaching decreased technostress when competence was high or moderate but not when competence was low. So, it seems that competence moderates the association between frequency of use and technostress, and competence can act as a resource that can protect against technostress (cf. Bakker & Demerouti, 2007; Hakanen et al., 2005; Tarafdar et al., 2011), as suggested.
There are limitations within this study. The first limitation concerns the fact that although variety of measures were included in the analyses, there are likely other factors associated with teachers’ technostress. For example, technostress studies in general indicate, for example, that the opportunity to participate in the selection of technologies is associated with lower levels of technostress (e.g. Tarafdar et al., 2011). The second limitation of the study relates to the fact that the items and scales were adopted from the OPEKA survey, which has not been developed for the purposes of scientific study. For example, there was only one item to measure technostress, concordance of ICT with the teaching style, and attitude to ICT. In practice, this means that some factors were operationalized and measured very narrowly, not necessarily covering all the aspects of the phenomenon. As an example, concordance of ICT with the teaching style was measured with the one item (“ICT fits my style of teaching”). Evidently, this is not adequate to cover all the aspects of the teaching style, beliefs, values, or behaviours (cf. Heimlich & Norland, 2002).
We suggest that the concept of concordance of ICT with teaching style in particular could be operationalized more broadly, since it was clearly associated with technostress. Previous studies also indicate that if teachers feel pressure to change their pedagogy and to use new technologies due to external requests, they are more likely to resist adopting the technology (Ertmer, 2005; Joo et al., 2016), whereas ICT integration in schools is likely to succeed if the ICT policy reflects teachers’ beliefs, attitudes, and values (Tondeur, Van Keer, van Braak, & Valcke, 2008). The feeling of discord (i.e. the feeling of ICT not fitting one’s teaching approach) may appear when teachers’ personal preferences conflict with requirements. Consequently, teachers may feel a diminished sense of agency and control over their work, which in turn may lead to technostress. This is in line with findings indicating that technostress is associated with increased role conflict, and the conflict may appear, for example, when professionals do not agree with the “best practices” offered by new technologies (Tarafdar et al., 2011).Furthermore, this discord might relate to a broader phenomenon, namely to professional identity. Therefore, it could be useful to develop more advanced measures of teaching style, beliefs, and practices to detect their deeper connections to technostress. For example, Beijaard, Verloop, and Vermunt’s (2000) categorization of teacher identities from professional knowledge and skills domain (subject, didactical, pedagogical) perspectives might provide suitable measures for future studies.
We have arrived at some practical suggestions based on our findings. First of all, the findings suggest that ICT competence is one of the key factors associated with technostress. In line with this notion, we assume that one effective way to decrease teachers’ technostress is to develop the ICT competence of teachers further, for example, by education. Moreover, our data suggest that sufficient school support – including, for example, arranged opportunities to share experiences and technical support – is associated with lower levels of technostress. Together, these findings indicate that ICT competences can be promoted most effectively in schools by utilizing, for example, peer teachers or mentors. In practice, more experienced teachers could teach together with less experienced teachers, or the teachers could share their know-how. This supports the notion that in addition to technical support, social support from peers, such as from colleague teachers, is necessary to reduce teachers’ technostress (Joo et al., 2016), and the results suggest that the effective ways to develop work well-being require the active involvement of all workers (Hassard, Cox, Murawski, De Meyer, & Muylaert, 2011). The school community should be considered as broadly as possible, including the pupils and students who can act as student agents to also teach the teachers. Secondly, it was shown that perceived concordance of ICT with the teaching style and the educational use of ICT were associated with lower levels of technostress. It is worth noting that teachers might not be yet aware of all the possible uses of educational technology, and therefore might not be able to evaluate whether these technologies are in concordance with their teaching style. Thus, one practical strategy could be to highlight the pedagogical enhancement related to different technologies when they are introduced to the potential users, since it shown that teachers consider pedagogical enhancement an important factor that influences the kinds of methods they use in their teaching (cf. Tallvid, 2014).
Aiken, L. S., & West, S. G. (1991). Multiple regression. Testing and interpreting interactions. Newbury Park: Sage.
Al-Fudail, M., & Mellar, H. (2008). Investigating teacher stress when using technology. Computers & Education, 51(3), 1103–1110.
Bakker, A. B., & Demerouti, E. (2007). The job demands-resources model: State of the art. Journal of Managerial Psychology, 22(3), 309–328.
Beijaard, D., Verloop, N., & Vermunt, J. D. (2000). Teachers’ perceptions of professional identity: An exploratory study from a personal knowledge perspective. Teaching and Teacher Education, 16(7), 749–764.
Campbell, E. (2008). The ethics of teaching as a moral profession. Curriculum Inquiry, 38(4), 357–385.
Çoklar, A. N., Efilti, E., Şahin, Y. L., & Akçay, A. (2016). Determining the Reasons of Technostress Experienced by Teachers: A Qualitative Study. Turkish Online Journal of Qualitative Inquiry, 7(2), 71–96.
Drenoyianni, H., & Selwood, I. D. (1998). Conceptions or misconceptions? Primary teachers' perceptions and use of computers in the classroom. Education and Information Technologies, 3(2), 87–99.
Durndell, A., & Haag, Z. (2002). Computer self-efficacy, computer anxiety, attitudes towards the Internet and reported experience with the Internet, by gender, in an East European sample. Computers in Human Behavior, 18(5), 521–535.
Ertmer, P. A. (2005). Teacher pedagogical beliefs: The final frontier in our quest for technology integration? Educational Technology Research and Development, 53(4), 25–39.
Ertmer, P. A., Ottenbreit-Leftwich, A. T., Sadik, O., Sendurur, E., & Sendurur, P. (2012). Teacher beliefs and technology integration practices: A critical relationship. Computers & Education, 59(2), 423–435.
Finnish National Board of Education (2016). National Core Curriculum for Basic Education 2014 (Publications 2016: 5). Finnish National Board of Education: Helsinki.
Fischer, T.; Riedl, R. (2015). Theorizing Technostress in Organizations: A Cybernetic Approach. In O. Thomas, & F. Teuteberg (Eds.), Proceedings der 12. Internationalen Tagung Wirtschaftsinformatik (WI 2015), Osnabrück, 1453 –1467.
Fuglseth, A. M., & Sørebø, Ø. (2014). The effects of technostress within the context of employee use of ICT. Computers in Human Behavior, 40, 161–170.
Hassard, J., Cox, T., Murawski, S., De Meyer, S., & Muylaert, K. (2011). Mental health promotion in the workplace: a good practice report (Working Environment Information, Working paper). Retrieved from European Agency for Safety and Health at Work, EU-OSHA website: https://osha.europa.eu/en/tools-and-publications/publications/reports/mental-health-promotion-workplace_TEWE11004ENN.
Hakanen, J. J., Bakker, A. B., & Demerouti, E. (2005). How dentists cope with their job demands and stay engaged: The moderating role of job resources. European Journal of Oral Sciences, 113(6), 479–487.
Heimlich, J. E., & Norland, E. (2002). Teaching style: where are we now? New Directions for Adult and Continuing Education, 2002(93), 17–26.
Hong, K. S., & Koh, C. K. (2002). Computer anxiety and attitudes toward computers among rural secondary school teachers: A Malaysian perspective. Journal of Research on Technology in Education, 35(1), 27–48.
Hudiburg, R. A. (1989). Psychology of computer use: VII. Measuring technostress: Computer-related stress. Psychological Reports, 64(3), 767–772.
Johnson, S., Cooper, C., Cartwright, S., Donald, I., Taylor, P., & Millet, C. (2005). The experience of work‐related stress across occupations. Journal of Managerial Psychology, 20(2), 178–187.
Karasek Jr, R. A. (1979). Job demands, job decision latitude, and mental strain: Implications for job redesign. Administrative Science Quarterly 24(2), 285–308.
Joo, Y. J., Lim, K. Y., & Kim, N. H. (2016). The effects of secondary teachers’ technostress on the intention to use technology in South Korea. Computers & Education, 95, 114–122.
Karasek Jr, R. A. (1979). Job demands, job decision latitude, and mental strain: Implications for job redesign. Administrative Science Quarterly 24(2), 285–308.
Lim, B. (2012). Analysis of the elementary school teachers' needs on digital textbooks and its implications on the policy making. Korean Journal of Educational Technology, 28(2), 317–346.
Loyd, B. H., & Gressard, C. (1984). Reliability and factorial validity of computer attitude scales. Educational and Psychological Measurement,44(2), 501–505.
Ong, C. S., & Lai, J. Y. (2006). Gender differences in perceptions and relationships among dominants of e-learning acceptance. Computers in human behavior, 22(5), 816–829.
Pareto, L., & Willermark, S. (2014, September). Can Teachers’ Fragmented Work Situation Jeopardize Professional Development of Future Teaching Practices?. In European Conference on Technology Enhanced Learning (pp. 464-469). Springer International Publishing.
Ragu-Nathan, T., Tarafdar, M., Ragu-Nathan, B.S., & Tu, Q. (2008). The consequences of technostress for end users in organizations: conceptual development and empirical validation. Information Systems Research, 19(4), 417–433.
Ryan, R. M., & Deci, E. L. (2000). Intrinsic and extrinsic motivations: Classic definitions and new directions. Contemporary Educational Psychology, 25(1), 54–67.
Sairanen, H., Vuorinen, M., & Viteli, J. (2013). Collecting and Using Data to Develop Digital Learning Culture at School. Paper presented at Teacher Education Policy in Europe Conference, 16–18 May 2013, Helsinki, Finland.
Sairanen, H., Viteli, J., & Vuorinen, M. (2013). Laitteiden ja ohjelmistojen käyttö suomalaisissa kouluissa vuonna 2012. TRIM notes: 6. Tampereen yliopisto. Retrieved from http://urn.fi/URN:ISBN:978-951-44-9106-1.
Salanova, M., Llorens, S., & Cifre, E. (2013). The dark side of technologies: Technostress among users of information and communication technologies. International Journal Of Psychology, 48(3), 422–436.
Scherer, R., Siddiq, F., & Teo, T. (2015). Becoming more specific: Measuring and modeling teachers' perceived usefulness of ICT in the context of teaching and learning. Computers & Education, 88, 202–214.
Shah, M. M., Hassan, R., & Embi, R. (2012). Computer anxiety: data analysis. Procedia-Social and Behavioral Sciences, 67, 275–286.
Tallvid, M. (2014). Understanding teachers’ reluctance to the pedagogical use of ICT in the 1: 1 classroom. Education and Information Technologies, 1–17.
Tanhua-Piiroinen, E., Viteli, J., Syvänen, A., Vuorio, J., Hintikka, K. A., & Sairanen, H. (2016). Perusopetuksen oppimisympäristöjen digitalisaation nykytilanne ja opettajien valmiudet hyödyntää digitaalisia oppimisympäristöjä. Valtioneuvoston selvitys- ja tutkimustoiminnan julkaisusarja 18/2016. Retrieved from the Government’s analysis, assessment and research activities website: http://tietokayttoon.fi/julkaisu?pubid=11315.
Tarafdar, M., D’Arcy, J., Turel, O., & Gupta, A. (2015). The dark side of information technology. MIT Sloan Management Review, 56(2), 61.
Tarafdar M., Pullins E. B., & Ragu-Nathan T. S. (2015). Technostress: negative effect on performance and possible mitigations, Information Systems Journal, 25(2), 103–132.
Tarafdar, M., Tu, Q., Ragu-Nathan, T. S., & Ragu-Nathan, B. S. (2011). Crossing to the dark side: examining creators, outcomes, and inhibitors of technostress. Communications of the ACM, 54(9), 113–120.
Tondeur, J., Van Keer, H., van Braak, J. & Valcke, M. (2008). ICT integration in the classroom: challenging the potential of a school policy.Computers and Education, 51(1), 212–223.
Vahtivuori-Hänninen, S., Halinen, I., Niemi, H., Lavonen, J., & Lipponen, L. (2014). A New Finnish National Core Curriculum for Basic Education (2014) and Technology as an Integrated Tool for Learning. In H. Niemi, J. Multisilta, L. Lipponen, & M. Vivitsou (Eds.), Finnish Innovations and Technologies in Schools. A Guide towards New Ecosystems of Learning (pp. 21–32). Rotterdam, The Netherlands: SensePublishers.
Van der Doef, M., & Maes, S. (1999). The job demand-control (-support) model and psychological well-being: a review of 20 years of empirical research. Work & Stress, 13(2), 87–114.
Viteli, J. (2013). Teachers and Use of ICT in Education: Pilot Study And Testing of the Opeka System. In J. Herrington, A. Couros & V. Irvine (Eds.), Proceedings of EdMedia: World Conference on Educational Media and Technology 2013 (2326–2346). Association for the Advancement of Computing in Education (AACE).
Zhao, Y., & Frank, K. A. (2003). Factors Affecting Technology Uses In Schools: An Ecological Perspective. American Educational Research Journal, 40(4), 807–840.