National Research University,
Higher School of Economics, Russia
e-mail: aporshnev@gmail.com
Potsdam University, Germany
e-mail: giest@uni-potsdam.de
Students' internet usage attracts the attention of many researchers in different countries. Differences in internet penetration in diverse countries lead us to ask about the interaction of medium and culture in this process. In this paper we present an analysis based on a sample of 825 students from 18 Russian universities and discuss findings on particularities of students' ICT usage. On the background of the findings of the study, based on data collected in 2008-2009 year during a project "A ?ross-cultural study of the new learning culture formation in Germany and Russia", we discuss the problem of plagiarism in Russia, the availability of ICT features in Russian universities and an evaluation of the attractiveness of different categories of ICT usage and gender specifics in the use of ICT.
Keywords: students, ICT usage, Internet usage, learning, plagiarism, gender differences
The Internet audience and ICT usage in everyday life has drawn the attention of researchers in different countries. For example, the US population is studied in «The Pew Internet & American Life Project» (http://www.pewinternet.org). There are also studies that have focused more on ICT usage in higher education, including «Survey of ICT use in Norwegian higher education» (Wilhelmsen et al., 2009), “Classroom Technology in Business Schools” (Parker & Burnie, 2009), “Students of the network age: A complex portrait of English university first year students” (Jones, 2010), “The ECAR Study of Undergraduate Students and Information Technology” (Smith & Caruso, 2010). Contemporary research has shown that the picture drawn by Prensky is far from reality (e.g. Hargittai, 2010; Jones & Czerniewicz, 2010). The interaction between culture and technology is much more complicated than a simple generation gap. In her research, Hargittai found differences in internet skills among members of one generation tightly connected with their social environment (Hargittai, 2010), while Czerniewicz and Brown provide further empirical evidence, even within a South African context, of an “elite” group with native digital characteristics (2010). This leads us to the questions: How do national cultures and new technologies interact?, and Is the influence of new technologies universal in different countries? We cannot answer these questions now, but hope to at least make a step forward in discussing these issues. In our research for, “A cross cultural study of the new learning culture formation in Germany and Russia,”** we studied students’ behavioral and motivational patterns in learning and want to dedicate this paper to the following aspects of our study: A review of Russian students’ ICT usage and the problem of plagiarism, the availability of ICT features in Russian universities and an evaluation of the attractiveness of different categories of ICT usage and gender specifics in the use of ICT.
In Russia, the first psychological studies of Internet users were conducted by Arestova, Babanin and Voiskounky![]() From 1992 until 1998, they organized a series of research studies in which more than 3,000 Internet users took part, who studied socio-psychological, demographic and motivational dynamics of the Internet audience in Russia.
From 1992 until 1998, they organized a series of research studies in which more than 3,000 Internet users took part, who studied socio-psychological, demographic and motivational dynamics of the Internet audience in Russia.
After 1999, several organizations started monitoring the Russian Internet audience. For example, The Public Opinion Foundation (POF, http://www.fom.ru/projects/23.html) provided actual information about Internet penetration rates for Russian regions, social groups and demographic specifics of Internet usage. Apart from the general monitoring, the POF also organizes specials projects, e.g. “Kids in the information society” – ![]() http://bd.fom.ru/pdf/int.b1.pdf). In this project, usage of the Internet by school and university students was investigated in 2008-2009. Respondents were asked to answer questions about reading news, searching on the Internet, downloading audio and video content, online games, shopping and other possibilities for Internet usage, and for several of the questions we could compare data from our research with the data from the same year for the POF (for example with the question, “Did you happen to use the internet yesterday?”).
http://bd.fom.ru/pdf/int.b1.pdf). In this project, usage of the Internet by school and university students was investigated in 2008-2009. Respondents were asked to answer questions about reading news, searching on the Internet, downloading audio and video content, online games, shopping and other possibilities for Internet usage, and for several of the questions we could compare data from our research with the data from the same year for the POF (for example with the question, “Did you happen to use the internet yesterday?”).
There are also other organizations that monitor the Russia Internet audience such as TNS (http://www.tns-global.ru/) or ROMIR, although these companies primarily focus on market research. Furthermore, there are various studies of students’ ICT usage in particular Russian universities ![]()
In 2009, Voiskounsky organized research devoted to the problem of plagiarism in which he used methods proposed by Underwood and Szabo (Voiskounsky, 2009), so since Voiskounsky’s research was organized at about the same time as ours, we will compare results.
The main idea of our paper is to provide information about Russian students’ usage of ICT in learning and in everyday life, including information about ICT options that exist at Russian universities and students’ attitudes toward plagiarism. Additionally, we also want to go beyond the frequency of usage of different ICT tools to find answers to two questions. The first question is: Could we rely on data received about the ICT usage? In many studies, it has been shown that the method of data collection can influence the results, so we could therefore expect some influence from the social desirability factor. For games, fun or communication, we also could expect that students who used these online activities would experience flow (see Csikszentmihalyi, 1975; see also Higgins, 2006) and be less critical about the real frequency of ICT usage for these purposes. Would we observe that students in Russia overestimate the frequency of ICT usage by their peers, or will we receive a more complex picture that the frequencies for some categories (attractive) will be overestimated, while others will be underestimated?
In analyzing the answers, we considered that answers to a question about a concrete event would be more exact than answers about the frequency of an event. When answering a question about frequency, the respondents understood this to mean an overall picture as it usually does, and that this estimation could be more influenced by a person’s self-perception. Thus, comparing answers will allow us to investigate students’ perceptions about different categories of ICT usage.
The second question is about gender differences. Hargittai showed that males are more likely to be familiar with Internet know-how (2010). Smith and Caruso found that about half of the male respondents saw themselves as innovators or early adopters of new technologies versus just a quarter of females who chose these categories (Smith & Caruso, 2010). Can we expect the same picture in our research in Russia?
In our online form, we include questions from our research project “New learning culture: Conditions of efficient Internet usage by students"![]()
grant No 07-01-160 of Scientific Foundation of State University - Higher School of Economics), which were adapted and translated from the Pew Internet & American Life Project (2009) and from Classroom Technology in Business Schools (Parker & Burnie 2009), as well as new questions to gather information about students’ preferences in learning and ICT usage ( including most of the categories for everyday usage of ICT, in addition to the usage of new technologies for learning purposes).
For the analysis of the ICT use category of “attractiveness”, we used three sets of questions v11.1-v11.16, v13.1-v13.16 and v14.1-v.14.16. In v11, students were asked, “What did you happen to use the computer for yesterday?”, while in v13, “What do you think about how often other students are using the following features of the computer and the Internet?” and v14, “How often do you use the following features of the computer and the Internet?” For question v11, students were asked to mark the category if they used a computer for such a purpose yesterday. For questions v13 and v14, the respondents were asked to estimate the frequency of use on a scale for every one of the 16 categories (see Appendix 1): “Several times in day,” “Once a day,” “3-5 days in a week,” “1-2 days in a week,” “Every few weeks,” “Less often” and “Never” (see Appendix 1 for the entire list of questions).
For data collection, we used an online questionnaire (the online service Survey Monkey), which makes it possible to reach a large number of Russian students distributed in different Russian regions, while ensuring the same research conditions for our respondents.
To start our research, we sent invitations to the leading Russian universities included in a list from the ReitOR Agency ![]() http://www.reitor.ru), and placed an invitation in the university’s forums. As a result, a number of universities reported that they were ready to cooperate and organize a survey of their students (e.g. Vyatka State University, Ural State University and others). In some universities, students learned about our study from the news portal and took part in it that way (e.g. State University - Higher School of Economics Moscow). There were also several universities not included among the top list of leading universities, although professors from these universities gained information about our study from colleagues and helped organize the student participation. The administration’s help was needed to receive a representative sample in the Internet survey, as not all of the students had Internet access at home.
http://www.reitor.ru), and placed an invitation in the university’s forums. As a result, a number of universities reported that they were ready to cooperate and organize a survey of their students (e.g. Vyatka State University, Ural State University and others). In some universities, students learned about our study from the news portal and took part in it that way (e.g. State University - Higher School of Economics Moscow). There were also several universities not included among the top list of leading universities, although professors from these universities gained information about our study from colleagues and helped organize the student participation. The administration’s help was needed to receive a representative sample in the Internet survey, as not all of the students had Internet access at home.
In total, our study involved 1,119 respondents, but after the exclusion of incomplete responses and filtering by the date of entry to the respective university, we obtained a sample of 865 students (247 men, 618 women) from 18 universities in the European part of Russia (see Figure 1).
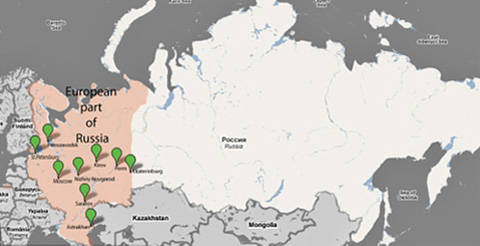
Figure 1: The geography of the research; - Location of universities where the students took part in our research
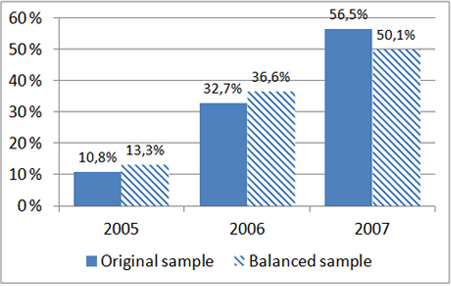
The gender proportion of the received sample was significantly different from the gender proportions of the Russian population between the ages of 20 to 24 (Chi-square criteria, p>0.05). According to the official statistics, it was 52% (women) and 48% (men) (http://www.gks.ru/doc_2010/demo.pdf), so for the analysis of ICT usage we used a balanced sample.
A balanced sample was created by randomly excluding 56% of the female respondents, while the rest of the female sample (270 female respondents) was tested for significant differences from the entire Russian female sample (in relation to questions about specialization, birth year, university level, computer ownership and frequency of e-mail usage). All the differences were non-significant (Chi-square criteria, p>0.05). As a result, a sample with 270 females and 247 males has a close proportion of men (47.8%) and women (52.2%) among young Russians, which is almost identical to that of the aforementioned official statistics.
In our research, students participated from 14 leading universities (from a list of the 50 best universities in Russia) and four high-level universities (universities not included on the list of the 50 best universities in Russia). The primary amount of data,95.7%, was collected during September-October of 2009. In Appendix 2, a description of the parameters of the original (865 students) and balanced samples (517 students) is presented.
Responding to the question, “Did you happen to use the internet yesterday?”, 90.9% of the respondents answered “Yes,” 8.9% “No” and 0.2 % “Don’t know or refused” (in this section, the analysis was based on a balanced sample).
According to the research data provided by the POF, the percentage of Russian students who use the Internet every day is 57% as opposed to 79% for the students using the Internet every week. Comparing these results, we should mention that the sample of POF respondents contained 258 students from the whole of Russia, and was not limited to only the best or the good universities. Hence, we think that the results are comparable and that students from the best and good universities from the European region of Russia use the Internet and computer more often than students on average.
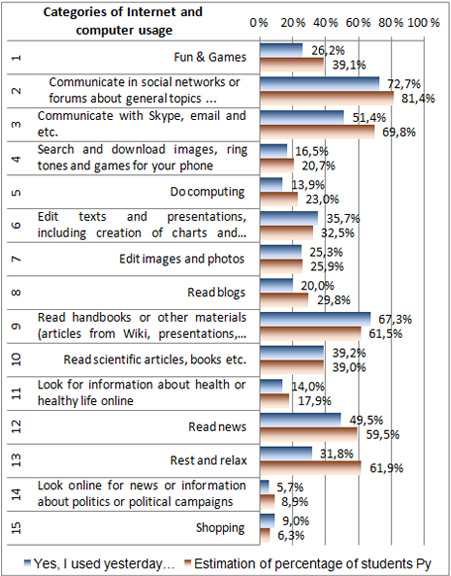
The following question: “What did you happen to use the computer for yesterday?” has only been presented to those respondents who answered “Yes” to the question, “Did you happen to use the internet yesterday?”
From studying Histogram 1, students apparently most often use social networks for reading/learning materials, Skype, e-mail and news. It is rare for Russian students to search for information about politicians and political campaigns, and to shop on the Internet.
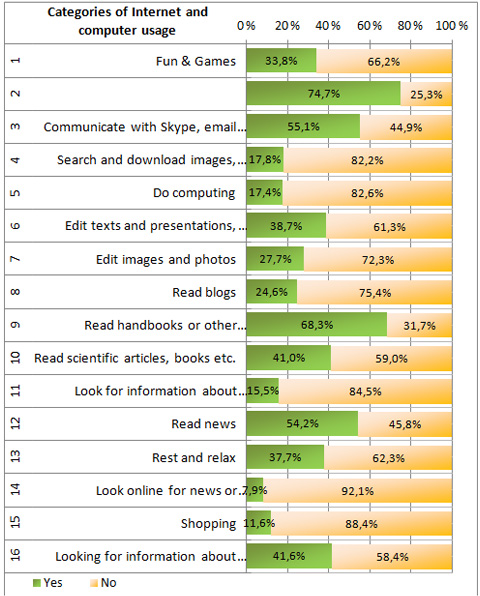
Histogram 1: Students’ answers to the question, “What did you happen to use the computer for yesterday?”
Unfortunately, we cannot precisely compare our data with the data received in the POF research since in the report, “Kids in the Information Society,” the question about Internet usage was asked about the normal activities of the students over the past month. However, we can compare tendencies: According to the POF, the most popular usage is for e-mail and then social networks, though we did notice that social networks are more popular among the students from our sample (high-level universities from the European part of Russia). According to our research, the percentage of students who used their social networks yesterday was 74.7%, whereas the POF data revealed that only 53% of the students used their social networks at least once over the past month, thereby showing that Russian students from high-level universities are much more engaged in communication through social networks.
Answering question v15 about information overload, 85.7% of the students answered that they liked having access to the information, 8.7% felt that they were overloaded by the information and 5.6% said they “Don’t know or refused” (see Histogram 2). In the research for the Annual Gadgets Survey 2007 (Pew Internet and American Life Project) organized in the US, 24% of the respondents agreed that they felt that they were overloaded with information, 64% said that having access to information was pleasant and 7% said they “Don’t know or refused.” It is necessary to note that there are two factors which influence comparability of the data: 1) The difference in the data gathering method used, and 2) A difference in the samples. We conducted online research, while in the Pew Internet Project, which specializes in telephone surveys, only 12% were between the ages of 18 to 24 years, whereas 98.7% of the participants in our research belonged to this age group. We suggest that our sample had more influence on the difference, thus we can conclude that the majority of the Russian students like to have access to information, although with the growth in the penetration of technologies we would expect to see a growing group of information-overloaded students.
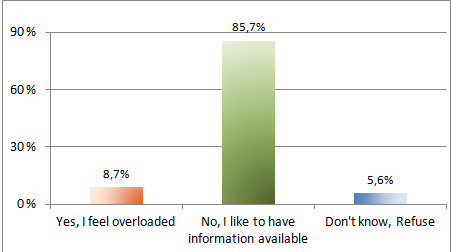
Histogram 2 - Students’ answers to the question, “Do you feel overloaded with information from different sources (TV, magazines, newspapers and the Internet), or do you like having so much information available?”
For the next set of questions about the technologies in universities, v10.1-v10.16, we used a set of question categories suggested by Parker and Burnie (2009). In Histogram 3, we have presented the average data for a group of universities, as this allows us to demonstrate the distinctions present for the availability of equipment and technologies. We arranged the universities into three groups: Research Universities (included in the list of research universities at http://mon.gov.ru/pro/niu/6077/), Best Universities (included in the list of the top 50 universities in Russia (except for research universities) and Good Universities (other universities not included in the list of best universities, from which students took part in our research) (a distribution of the data from the sample between different groups of the universities is presented in Appendix 2, Histogram 5).
The answers to this question showed that universities provide Internet access to students in computer classes, but only in research universities can the majority of students connect their own laptop to the university’s network (Histogram 3).
In all the universities, the majority of students noticed that their university learning materials were available in an electronic form. There were no significant differences in the availability of electronic materials for students between universities, but we observed significant differences between specializations, as IT faculties provide their students with significantly more information in electronic form (Chi-square criteria used, p<0.05). The difference between economics-related faculties, technical and natural-scientific faculties and humanity faculties was found to be non-significant (Chi-square criteria used, p>0.1).
In Histogram 3, we can see that Research- and Best Universities were better equipped with projectors. In comparison with the other groups, the students in Research Universities reported that they had free of charge access to scientific databases and could solve organizational questions using the Internet.
The group of Good Universities only provides better support for their students in the category of, Interactive learning programs. In this category, 43.1% of the students answered that they have such a possibility, while in the Best Universities the percentage is 21.6%, and surprisingly, only 16.1% in Research Universities. We can therefore assume that interactive learning programs would be less popular in Research- and Best Universities, as they are less effective and less flexible as a good teacher, though they could be used for reducing the overload for the teaching staff.
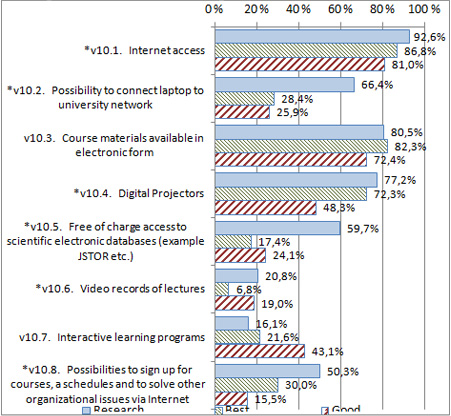
*Categories with significant differences (Chi-square criteria, p<0.05)
Histogram 3: Percentage of students’ “Yes, available” answers for categories of equipment or technologies. Question: “What kind of teaching technology and equipment do you have in your university?”
Answers about solving organizational problems via the Internet displayed differences among the various faculties at the different universities. Surprisingly, students from IT faculties had fewer possibilities to solve organizational questions through the Internet, as only 27.4% of students answered that they had such a possibility. Leadership in this category belongs to economic related faculties, at 46.3%, while differences between economic-related faculties and IT-related faculties were significant at the p<0.05 level (Chi-square test). At technical- and natural/scientific-related faculties, as well as –and at humanity faculties, 32.2% and 31.1% of students, respectively, agreed that they have such a possibility. This demonstrated that learning management systems were not widely applied in Russian universities in 2009, as one of the effects of these systems is the possibility to manage different organizational issues online throughout the entire university.
To analyze the attitudes of Russian students toward plagiarism, we used question mb28, “Do you copy and paste texts from books or the Internet without citing them?” An analysis revealed that there are no significant differences in attitudes toward plagiarism between women and men (Chi-square test, p>.05), so for the analysis in this section we used the original sample (865 participants).
In Histogram 4, we could see that 26.4% of the Russian students asserted that they copy texts from books and the Internet without referring to their sources, thereby making plagiarism is a common practice for many Russian students.
At the same time, Voiskounky (2009) organized more detailed research about academic dishonesty in Moscow universities. One of the questions Voiskounky asked in his research was, “Under which of the following conditions would you hand in information readily available on the Internet as your own work?” According to Voiskounsky, 27% of college seniors responded, “At any time”, which is comparable to the results of our research at 26.4% as stated above.
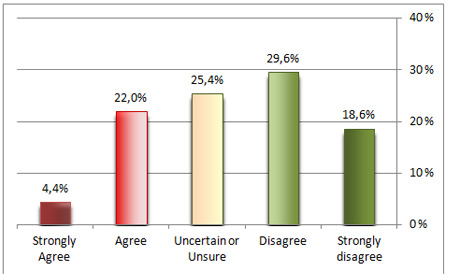
Histogram 4: Students’ answers to the question, “Do you copy and paste texts from books or the Internet without citing them?”
Next, we decided to look deeper into the categories of universities – Research, Best and Good. Although the plagiarism problem is serious in all three types of universities, the picture in Research Universities is much better (see Histogram 5). In Research Universities, 66.2% of the students said that they do not copy from the Internet, while at the Best Universities the percentage of such students is 43.2 %, and in the Good only 30.8%. The percentage of students agreeing (for both Categories of answers: “Strongly Agree” and “Agree”) with the question, “Do you copy and paste texts from books or the Internet without citing them?” was 16.3% in Research Universities, 29.3% in Best Universities and 35.5% in the Good Universities.
In our analysis of the plagiarism problem, we agree with the findings of Voiskounsky that this situation is taking place because of the teaching staff at the universities. In his article, Voiskounky writes that, “Right now, nevertheless, it is unlikely that the tutors are either filtering plagiarism out or making attempts to stop it” (Voiskounky, 2009, p.582). In his study, more than two-thirds of the students are not sure if their tutor’s expertise is high enough to recognize plagiarism, while one-fourth of the students think that it is worth plagiarizing even if their tutors would definitely recognize it. Students’ attitude towards plagiarizing even if the tutor would know emerges because tutors do not want to spend their time finding pieces from the Internet and blaming dishonest students (Voiskounky, 2009).
Comparing data from our research with the research of Voiskounky, we can see that tutors in Research Universities pay more attention to preventing dishonest behavior. To the best of the authors’ knowledge , tutors in research universities used anti-plagiarism systems (for example, http://www.antiplagiat.ru/), and professors tried to give students non-standard, creative tasks.
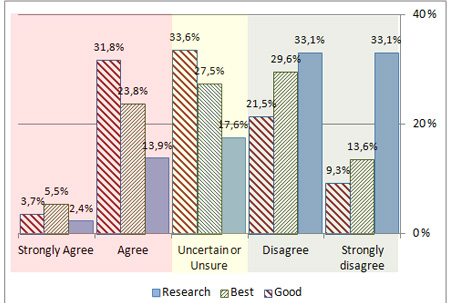
Histogram 5: Students’ answers to the question, “Do you copy and paste texts from books or the Internet without citing them?” by groups of universities: Research, Best, Good
In analyzing the answers of the respondents while studying the different specialties, we can say with assuredness that among students learning an IT-related specialty, significantly more students agreed that they copy and paste texts without citing them (p <0.05, Chi-square test). These results could be interpreted in such a way that students from IT faculties are more successful in their use of new technologies, in that they have enough expertise not to be caught by tutors. Hence they plagiarize. Another possible interpretation provided by Voiskounky, which is not an alternative to the above one, is based specifically on higher Russian education (2009). His interpretation is that students have a limited choice in subjects in addition to their specialization, so for students studying in IT-related faculties non-professional subjects would be humanities, and vice versa for students from the humanities in that it would be mathematics, physics, etc. In Russia, it is more likely that a humanities tutor would ask students to write an essay, whereas a mathematics tutor would ask them to solve a set of exercises. The themes of the essays described in the State Educational Standard ![]() are usually used by many teachers, therefore essays on these topics are widely present on the Internet. Taking into account that writing essays is a different skill from programming, with a short duration for non-professional subjects, it is obvious that IT students will try to avoid doing this task.
are usually used by many teachers, therefore essays on these topics are widely present on the Internet. Taking into account that writing essays is a different skill from programming, with a short duration for non-professional subjects, it is obvious that IT students will try to avoid doing this task.
We should go ahead and admit that plagiarism is common among students at Russian universities and agree with Voiskunsky’s opinion that the dominant role here is not only technological experience, but also the learning environment and learning culture at the university.
To analyze how precise the participants were in answering questions about frequency, we started by looking at Category 1, Usage ICT for games and entertainments. We found out that 126 respondents (from an original sample of 865 students) answered that for this purpose they used the computer more often than once a day (v14.1), but when looking at the answers from these same respondents for question v10.1, we found out that 33.3% (42) of them did not used a computer for this purpose yesterday. Also, there were three respondents who answered that they never play games (question v14.1), but according to their answers on question v10.1 they did it yesterday. An analysis of Category 9 revealed that students were more precise, as only 21 (12.8%) out of 164 answered that they read handbooks or other materials more often than every day, and for the purposes of this category, did not use a computer yesterday. A further analysis showed that the more precisely that the category was formulated, the more students answered that they use it every day, thereby yielding more precise information about their frequency of usage have.
Comparing estimations of the respondents in terms of how often other students use ICT and how often they use a computer themselves, we find that the categories with the greatest divergence are: 1 “Fun & Games,” 4 “Search and download images, ring tones and games for your phone,” 8 “Read blogs” and 15 “Shopping.”. Within these categories, students note that other students carry out actions from these categories more often than themselves. For example, in Category 1, “Fun & Games” (see Histogram 6), only 14.6 % of students said that they play at least once a day, but when answering about other students, 35.5 % of the respondents noticed that other students play at least once a day. An overestimation in the frequency of the realization of actions by other students testifies to the attractiveness of this category of ICT use for students, and it is necessary to note that we observe a similar situation in 13 of the 16 categories of use.
It is interesting to note that Category 5 “Do computing” is an attractive category for students. But we do not think that this is unusual. We know a lot of examples of students who do computing and find this activity very creative and interesting. It also proved by other authors, for example Babaeva and Voiskounky ![]()
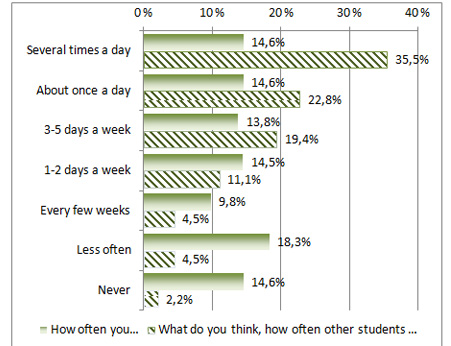
***Histogram 6: Comparison students’ answers to a questions «What do you think about, how often other students use the following features of computer and Internet? » and «How often you use the following features of computer and Internet?» for Category 1 “Fun & Games”.
In only on three categories: #9, #10 and #11, respondents reported that they do actions from the given categories more often, than other students. For example, at Category 9 - 19% of students answered that they do it several times a day and 16% of students answered that other students do it “Several times a day” (see histogram 7). Thereby, these categories could be marked as “valuable”, noticing that students know that it important to do, even if it is not pleasant. However the attractiveness of category does not predict level influence on level of accuracy in frequency measurement.
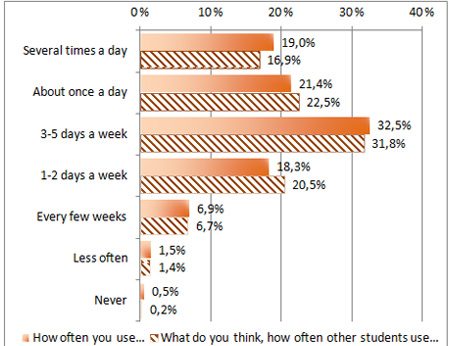
Histogram 7: Comparison of students’ answers to a questions «What do you think about, how often other students use the following features of computer and Internet? » and «How often do you use the following features of computer and Internet?» for Category 9 “Read of handbooks or other materials (articles from Wiki, presentations, essays etc.)”
Trying to compare v10 and v14 not only at the personal level we decided to approximate quantity of answered "Yes" on a v10 question, taking into account the data about frequency of students’ ICT use (v14). If the student answered that he or she uses ICT – “Several times every day” or “Once a day” for “Fun & Games” it is logical to assume that yesterday he or she used it too. If the student answered that he uses computer for “Fun & Games” 3-5 days in a week it is possible to assume that in average four days from seven days he uses it, so the probability of that the computer has been used for this category yesterday is 4/7. Using a similarly argument, we estimate that the probability of use yesterday for the answers “1-2 days in a week” approximately 1/7.
Thus, the percent of students who used computer and Internet yesterday for Category 1 can be approximately estimated under the formula:
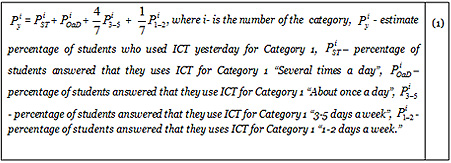
Histogram 8: Comparison of percentage of students answered that they used computer and Internet yesterday and estimated percentage PY calculated with formula (1) by categories of ICT usage.
We expected that Russian students overestimate their frequency of ICT usage and in the result we received a picture, which confirmed our expectations (see the histogram 8).
Thereby, we could conclude that Russian students overestimate frequency for most attractive categories of ICT usage. Frequency self-evaluation influenced by personal perceptions and could not be regarded as absolutely reliable source of information. We could expect that in different countries students could vary in frequency estimation and for cross-cultural comparison would be essential to have several measurements.
Analyzing answers to the question v8 about computer ownership we can see gender differences. For example, more male than female students have their own computer for six or more years. Still 4,2 % of female students and only 0,4% of male students do not have their own computer. It is worth noting that the majority of respondents get their own computer with Internet access while studying in senior classes of school, or right after entering the university (see the histogram 9).
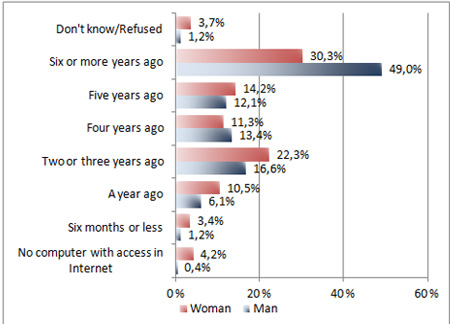
Histogram 9: Students’ answers to a question «Since when have you got your own computer with Internet access?».
Analyzing the question v11a shows that there is a significant difference in the percentage of males and females who used the Internet yesterday (Chi-square criteria, p<0.05). A larger percent of men answered that they had used the Internet yesterday 94.7 %, for women the percentage is 86.6 % . Answer “Don’t know or Refuse” choose 0.4 % of young men and 0,3 % of young women. The percentage of students who answered “No”: is 13.1 % for female students and only 4.9 % for male (see the histogram 9).
Gender analysis of answers to the question v15 about an information overload shows no significant differences. 84.6 % of young men and 81.6 % of young women have answered that they like to have access to the information.
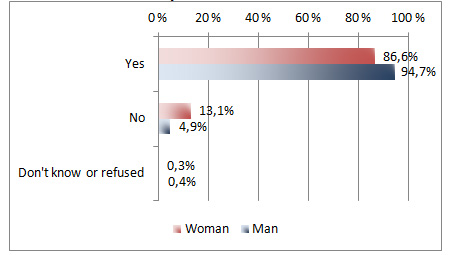
Histogram 10: Answers for a question: “Did you happen to use the Internet yesterday?”
Analyzing gender differences in answers to the questions v11.1-v11.16 we can say that for all 16 categories male students more than female used the Internet and computer yesterday. For 12 categories of use of the Internet and computer, we observe significant differences by Chi-square criteria with p <0.05 (the histogram 6).
Although fewer female students used the computer yesterday and the Internet for reading scientific articles and books, we could not conclude that they were less interested in learning or in researching. Our experience in working with Russian students let us assume that this is connected with the attitude to visiting library and using hard copies of scientific papers or books.
Significant differences weren't present only on the following categories of use: 2 – “Communicate in social networks or forums on general topics (Facebook, students forums etc.)”, 4 – “Search and download images, ring tones and games for your phone”, 9 – “Read of handbooks or other materials (articles from Wiki, presentations, essays etc.)”, 11 – “Look for information about health or healthy life online” (the histogram 11).
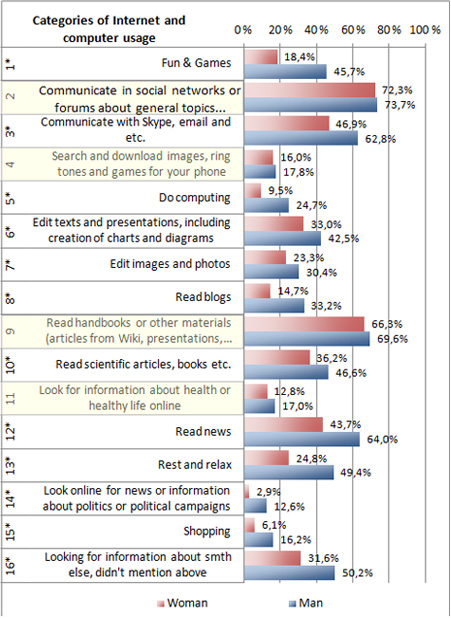
Histogram 11:Students’ answers to a question “What for did you happen to use the computer yesterday?” (For categories with * differences are significant p<0.05).
As we observe the significant differences in ICT usage we could conclude that male students are more interested in usage computer for playing games, rest and relax, read news, communicate with Skype and etc..
This tendency has also been noted in the dynamics of Internet auditorium in Russia, since 2003 monitoring of POF shows that the percentage of Internet user among men is bigger than the percentage of Internet users among women. For example, in 2009 percentage of Internet users among of men was 37%, among women 30% (POF 2009, http://bd.fom.ru/pdf/int0309.pdf).
After analysis of research data about students’ ICT use in learning and in everyday life, we can note the following:
Answering the questions raised at the beginning of the paper, we could notice that application of technologies do not start from blank page and culture plays a big role. For example, wide usage of plagiarism by students determines not only by easy of copy and paste, but also by attitudes and behavior from teachers.
Regarding to universality in technology application, we could mention, that in Russia data support the main tendency that males are more active in usage of ICT than females. This could be explained by universality of gender roles and universality of gender values, as it showed by Schwartz and Rubel in data integrated across 127 samples man more than women, endorsed power and achievement, and woman more than men, tended to endorse the values of benevolence and universalism (2005).
Comparing with data received in a German sample (with a similar technique and equivalent double-blind translated questions) we could admit that German and Russian students have a lot of similarities like attitude towards reading (handbooks, scientific articles, news, blogs), they treat Internet as source of relaxation and rest, and also they wish to choose more practical courses. Although there are some differences: for example German students more often use Skype and email, editing presentation, texts and graphs, shopping. Russian more often use social networks and download music and pictures for mobile phones. Also plagiarism problem is more serious in Russia. More information about our results received from the German and Russian sample can be found in Porshnev & Giest (2010). Also we plan to provide more detailed comparison of Russian and German students’ ICT use in following publications.
Unfortunately, distinctions in data collection techniques allows us only to make approximate comparison with results received by Jones (2010); Shao, Jones and Richardson (2010); Nordkvelle (2010). Approximate comparison shows: firstly, students’ use of ICT in Russia has cultural specific, secondly it occurs within the limits of a universal trend – connected with increase influence of ICT on society.
Analyzing a universal trend, we can expect that with further penetration of ICT in Russia, more and more universities will offer students possibilities of interaction through ICT and research in this area will need to continue. In our further research we plan to organize a more detailed study of the information environment in universities, with use of various methods, such as focus of group and day experience method. Also we plan to continue cross-cultural comparison of ICT use.
Preparation of this paper was supported by funds The Higher School of Economics Academic Fund Program 2010-20012 (#10-01-0021), and Alexander von Humboldt Foundation grant 3.1-RUS/1130038 BUKA to Alexander Porshnev.
We thank two anonymous reviewers for their helpful feedback and suggestions on this paper and Prof. Avraam Levin, Valery Porshnev and Prof. Elena Porshneva for comments and advices during the planning, organizing and conducting the study.
Prof. Marina Bagramyants, Dr. Regina Ershova, Gennadii Gludin, Dr. Renat
Kamalov, Dr.Elena Mamonova, Prof. Ludmila Obukhova, Prof. Sogia Gaponova, Prof. Alexander Voiskounsky, Prof. Ludmila Zakharova, Dr. Elena Ivanova, Prof. Alexander Chastikov, Prof. Natalia Dorshakova, Prof. Alexander Sytnik for help in organizing data collection at the universities of Russia.
Csikszentmihalyi, M. (1975). Beyond boredom and anxiety. San Francisco: Jossey-Bass.
Czerniewicz L. & Brown C. (2010). Born into the Digital Age in the south of Africa: the reconfiguration of the ‘digital citizen’. In L. Dirckinck-Holmfeld, V. Hodgson, C. Jones, D. McConnell & T. Ryberg (Eds.) Proceedings of the 7th International Conference on Networked Learning, Aalborg 3–4th May 2010, 859–865
Hargittai, E. (2010). Digital Na(t)ives? Variation in Internet Skills and Uses among Members of the ‘‘Net Generation’’. Sociological Inquiry, 80(1), 92-113.
Higgins, E. T. (2006). Value from hedonic experience and engagement. Psychological Review, 113(3), 439–460
Jones C. (2010). Students of the network ages: A complex portrait of English university first year students. Paper presented at European Conference on Education Research – ECER 2010
Jones, C. & Czerniewicz, L. (2010). Describing or Debunking? The Net Generation and Digital Natives. (Editorial to Special section). Journal of Computer Assisted Learning, 26(5), 317-320.
Nordkvelle Y.T. (2010). Students’ use of technologies in Norway. Paper presented at European Conference on Education Research – ECER 2010
Parker, B., & Burnie, D. (2009). Classroom Technology in Business Schools: A Survey of Installations and Attitudes Toward Teaching and Learning. AACE Journal, 17(1), 45-60.
Porshnev A. & Giest H. (2010). Entwicklung einer neuen Lernkultur in Deutschland und Russland: Eine kulturvergleichende Studie (Berichtsentwurf in Tabellen und Diagrammen) , Retrieved from http://www.lkultur.com/report_de_11072010.pdf
Schwartz, S. H., & Rubel, T. (2005). Sex differences in value priorities: Cross-cultural and multimethod studies. Journal of Personality and Social Psychology, 89(6), 1010–1028.
Shao B., Jones C. & Richardson J. (2010). University students’ use of technologies in China Presentation at ECER 2010, Helsinki
Smith, S.D., & Caruso, J.B. (2010). The ECAR Study of Undergraduate Students and Information Technology, 2010 (Research Study, Vol. 6). Boulder, CO: EDUCAUSE Center for Applied Research, 2010. Retrieved from http://www.educause.edu/ecar
Voiskounsky A.E. (2009) Web Plagiarism: Empirical Study. Psychology in Russia: State of the Art, 2009, 564-583
Wilhelmsen, J., Ørnes, H., Kristiansen, T., & Breivik J. (2009) Digitale utfordringer i høyere utdanning. Norgesuniversitetets IKT Monitor. Norgesuniversitetets skriftserie 1/2009 Tromsø: Norgesuniversitetet, 44
Retrieved from http://www.nbuv.gov.ua/Articles/crimea/2004/doc/265.pdf
Retrieved from http://www.lkultur.com/report_ru_01072010.pdf
Questions from a project “A cross cultural study of the new learning culture formation in Germany and Russia” (English version)
v1. Sex male/female
v2. Please enter your birth date ______
v3. At that faculty you are studying ___________ (example, psychology)
v4. Please enter name of your University
v5. What is your specialization ________________________ (for example social psychology)
v6. Since when you have you own computer with Internet access
v7. When do you enter the university _____
v8. Since when you have you own computer with Internet access
v9. How often do you use the internet or email
What kind of Teaching Technology and Equipment have you in your University
v10.1. Internet access
v10.2. Possibility to connect laptop to university network
v10.3. Course materials available in electronic form
v10.4. Digital Projectors
v10.5. Free of charge access to scientific electronic databases (example JSTOR etc.)
v10.6. Video records of lectures
v10.7. Interactive learning programs
v10.8. Possibilities to sign up for courses, a schedules and to solve other organizational issues via Internet
v15. Do you feel overloaded (by TV, magazines, newspapers, and the internet), or you like having so much information available? (Mar 25, 2009, Pew Internet & American Life Project)
v11a. Did you happen to use the internet yesterday? (Mar 25, 2009, Pew Internet & American Life Project)
What for did you happen to use the computer yesterday?
v11.1. Fun & Games
v11.2. Communicate in social networks or forums on general topics (Facebook, students forums etc.)
v11.3. Communicate through Skype, e-mail. mail, etc.
v11.4. Search and download images, ring tones and games for your phone
v11.5. Do computing
v11.6. Edit of texts and presentations, including creation of charts and diagrams
v11.7. Edit images and photos
v11.8. Read blogs
v11.9. Read of handbooks or other materials (articles from Wiki, presentations, essays etc.)
v11.10. Read scientific articles, books etc.
v11.11. Look for health or medical information online
v11.12. Read news
v11.13. Rest and relax
v11.14. Look online for news or information about politics or the campaign
v11.15. Shopping
v11.16. Look for online information about something not mentioned above
Questions about plagiarism was included in Motivational block (items mb6 and mb28)
Respondents were asked to choose answer from following scale:
|
Strongly disagree |
Disagree |
Uncertain or Unsure |
Agree |
Strongly agree |
mb1. I prefer course material that really challenges me so I can learn new things
mb2 There are courses I am so interested in, that I continue studying even if I have to work more than necessary (for example, participate in research groups)
mb3 Some of task provide me such a pleasure from using my creativity, that I want to spent more time doing them than it is necessary for the exam.
mb4 Getting a good grade is the most satisfying thing for me right now
mb5 I make the tasks, because otherwise I will have troubles.
mb6 My group mates copying a few paragraphs from a book/internet to their work uncited.
mb7 I do not have time to review all recommended literature.
mb8 When I take a test I think about how poorly I am doing compared with other students
mb9 When studying for this course, I often try to explain the material to a classmate or a friend.
mb10 I share my works in Internet (in the blog, site or forum), because I want to receive feedback.
mb11 Even if I have trouble learning the material in this class, I try to do the work on my own, without help from anyone.
mb12 If I have the trouble in learning I use to use Internet communities
mb13 If I know that I could not achieve a good mark at this course, I try not to choose it.
mb14 If I can, I want to get better grades than most of the other students
mb15 If I know that I could find solution to the tasks in Internet or my group mates could give it to me, I will not do it by myself.
mb16 If I have a choice between creative exercise and formal one I prefer the creative, even if it could be more complicated
mb17 The main target for me is to pass exams
mb18 When I take tests I think of the consequences of failing.
mb19 I have an uneasy, upset feeling when I take an exam.
mb20 I try to work with other students from this class to complete the course assignments.
mb21 I share my works in Internet (in the blog, site or forum), because I like to help others
mb22 I ask the instructor to clarify concepts I don't understand well.
mb23 I ask questions on Internet forums to clarify concepts I don’t understand well.
mb24 When I have the opportunity in this class, I choose assignments that I can learn new things, even if they don’t guarantee a good grade.
mb25 During my studying in University I became so interested in one or several subjects that it influences my choice of the future professional activities.
mb26 I want to do well because it is important to my family, friends, employer, or others.
mb27 If I have possibility to avoid doing the tasks, I will use it.
mb28 I copy and paste to my work a few paragraphs from a book/internet uncited.
mb29 I feel my heart beating fast when I take an exam.
mb30 When I take a test I think about items on other parts of the test I can't answer.
mb31 When studying for this course, I often set aside time to discuss the course material with a group of students from the class.
mb32 During the course I used to discuss the materials on-line
mb33 When I can't understand the material in this course, I ask another Student in this class for help.
mb34 I have several favorite Internet communities to found and discuss information about my profession in future
What do you think about, how often other students use the following features of computer and Internet?
Respondents were asked to choose answer from following scale:
|
Several times a day |
About once a day |
3-5 days a week |
1-2 days a week |
Every few weeks |
Less often |
Never |
Don't know/ refused |
v13.1. Fun & Games
v13.2. Communicate in social networks or forums on general topics (Facebook, students forums etc.)
v13.3. Communicate through Skype, e-mail. mail, etc.
v13.4. Search and download images, ring tones and games for your phone
v13.5. Do computing
v13.6. Edit of texts and presentations, including creation of charts and diagrams
v13.7. Edit images and photos
v13.8. Read blogs
v13.9. Read of handbooks or other materials (articles from Wiki, presentations, essays etc.)
v13.10. Read scientific articles, books etc.
v13.11. Look for health or medical information online
v13.12. Read news
v13.13. Rest and relax
v13.14. Look online for news or information about politics or the campaign
v13.15. Shopping
v13.16. Look for online information about something not mentioned above
How often you use the following features of computer and Internet?
Respondents were asked to choose answer from following scale:
|
Several times a day |
About once a day |
3-5 days a week |
1-2 days a week |
Every few weeks |
Less often |
Never |
Don't know/ refused |
v14.1. Fun & Games
v14.2. Communicate in social networks or forums on general topics (Facebook, students forums etc.)
v14.3. Communicate through Skype, e-mail. mail, etc.
v14.4. Search and download images, ring tones and games for your phone
v14.5. Do computing
v14.6. Edit of texts and presentations, including creation of charts and diagrams
v14.7. Edit images and photos
v14.8. Read blogs
v14.9. Read of handbooks or other materials (articles from Wiki, presentations, essays etc.)
v14.10. Read scientific articles, books etc.
v14.11. Look for health or medical information online
v14.12. Read news
v14.13. Rest and relax
v14.14. Look online for news or information about politics or the campaign
v14.15. Shopping
v14.16. Look for online information about something not mentioned above
Samples description
Histogram 1. Distribution of collected data by year of entry to the university.
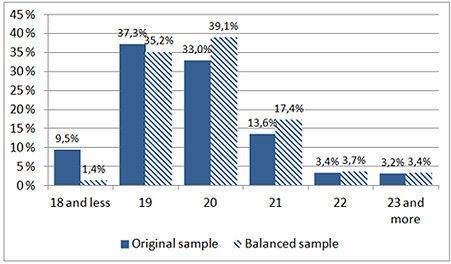
Histogram 2. Distribution of collected data by age.
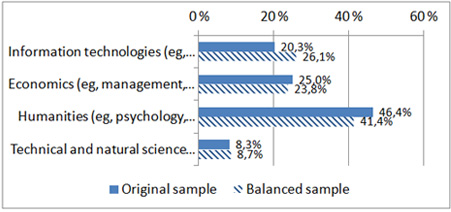
Histogram 3. Distribution of collected data by specialization.
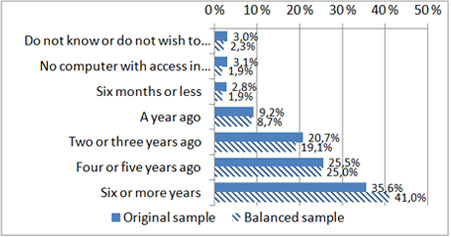
Histogram 4. Distribution of collected data by time of computer ownership.
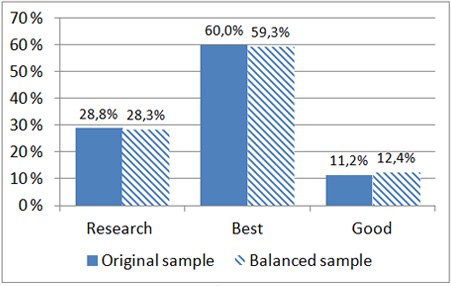
Histogram 5. Distribution of collected data by level of University.