Faculty of education,
Bergen University College, Norway
Email: gbj@hib.no
The present study investigates attitudes among student teachers toward using electronic resources in teaching. Two groups of student teachers, one composed of students in their first semester and the other composed of students in their third or fourth year, were asked to assess their skills and attitudes, before being shown an example of how open-source, Web-based data and software can be used in teaching English culture and history. The results show that student teachers are positive toward using technology, but that the teacher training program changes neither their attitudes nor their self-reported skills to any large extent.
Keywords: IT, attitudes to IT, open-source software, English, Web-based resources for teaching
Web-based resources and data provide new possibilities for online teaching and learning, as well as for blended approaches mixing online and face-to-face teaching (Dudeney & Hockly, 2007, pp. 136-137). However, such E-learning requires teachers that are both willing and able to make use of new technology in their teaching. The present study investigates attitudes toward using electronic resources in teaching English among student teachers enrolled in the English program at Bergen University College (HiB). Survey data and statistical methods are used to ascertain whether there are noticeable differences between experienced students (3-4 years of study experience) and new students (first semester at HiB), with respect to attitudes toward using electronic and Web-based resources in teaching.
With the Norwegian national curriculum in English from 2006 (henceforth LK06), using digital tools has been included as one of the basic skills in English (Ministry of Education and Research, 2006). Hence, it is of some interest to chart the attitudes and skills that student teachers specializing in English have with respect to such digital tools, or electronic resources (E-resources). Furthermore, it is interesting to measure to what extent these attitudes and skills are in place before the students embark on their studies, and to what extent they are shaped during their time as students. The study will hopefully provide an indication of the practices of the future teachers (with some caveats pertaining to the gap between attitudes and practice, as well as the limited size of the sample).
Following Dudeney and Hockly (2007, p. 136), E-learning is taken to refer to “learning that takes place using technology, such as the Internet, CD-ROMs and portable devices”. The term is understood in a wide context, which includes both online approaches (such as all-Internet based courses) and blended approaches, including approaches that make use of Internet resources in face-to-face course delivery. Teaching English with technology goes back at least to the 1980s. Its history can be further extended to the 1960s and 1970s if we include technologies such as language labs (Dudeney & Hockly, 2007, p. 7). The advantages to teaching English with technology are often discussed in connection with activities such as reading, writing, communication exercises, or grammar practice, see e.g Dudeney and Hockly (2007) or Lund (2009). The present paper will address two other perspectives that are relevant for teaching English with technology, namely historical and cultural background knowledge, and the ability to interpret numerical information in a graphical form. These are skills that are included among the intended learning outcomes in LK06 on a par with linguistic and communicative skills, and, as the second part of this paper aims to illustrate, numerical information and Web-based visualization techniques can provide new insights with respect to historical background knowledge. The study will report on findings from survey data and an informal classroom experiment involving the same respondents as test subjects.
The test subjects were all students of English at the Faculty of Education, Bergen University College (HiB), either in their first, or their third or fourth year. For each group there were 26 respondents, 52 in total. The students were, for the purposes of this study, classified as “new” in the case of the first-year students, and “experienced” in the case of the third or fourth year students. Such a classification is of course not exhaustive, and students in the “new” group might conceivably have considerable experience before starting their first semester at HiB. However, a difference in mean age between the two groups (2.5 years) does indicate that the “experienced” group on the whole is somewhat older (mean age experienced students: 24.0 years, mean age new students: 21.5 years); the difference is statistically significant with a Welch t-test ( = 2.22, p = 0.03). In other words, there is a small, but real, age difference between the two groups, which can reasonably be interpreted as a consequence of the additional amount of higher education taken by the “experienced” group. Thus, given the difference between the groups, we would also expect systematic differences with respect to attitudes and skills. Both groups of students were following broadly similar courses in English, although at a different pace and with some differences with respect to how the course modules were organized. Another potential confounding factor is that the “new” students attended a program aimed at primary school, whereas the “experienced” students attended a program aimed at primary as well as lower secondary school. The effects of these factors are discussed in the analysis section.
The data was collected by means of a questionnaire in two separate sessions, one for each group. Each respondent was asked to assess his or her own IT skills in general, as with respect to using the Web, and with respect to using office type software. For general IT skills and Web skills, the distribution of responses was more or less identical (see distribution for Web skills in figure 2). The distribution of office-software skills was somewhat different, as seen in figure 2. Furthermore, the students were asked to indicate the approximate number hours they had spent using a computer during the last 7 days, in addition to their attitude toward teaching with technology (websites, programs, online data etc.), both in general and in English. Finally, they were asked to supply their age, sex, and native language (with the exception of four students in the “experienced” group, all reported Norwegian as their native language). All the assessments (with the exception of the number of hours spent using a computer) were done using a 5-point scale, where 1 was low (“not useful”, “poor skills”) and 5 was high (“very useful”, “excellent skills”).
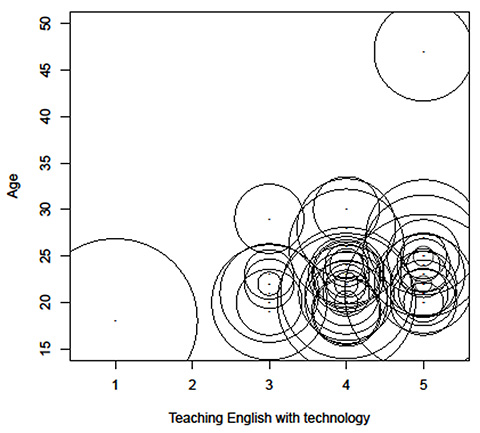
The main trends in the data are presented in figures 1 and 2. Figure 1 shows that attitudes toward teaching English with technology are, on the whole, positive (median 4), and that there is no clear correlation with either age or the number of hours spent on computer use. Figure 2 shows reported IT skills and attitudes to teaching English with technology broken down by group. Although “new” students report somewhat higher general IT skills, no dramatic differences between the groups present themselves in any of the plots. However, students appear to rate their office software skills lower than other IT skills.
Figure 1: Bubbleplot showing attitudes toward teaching English with technology (horizontal axis) plotted against age of respondent (vertical axis). [i]
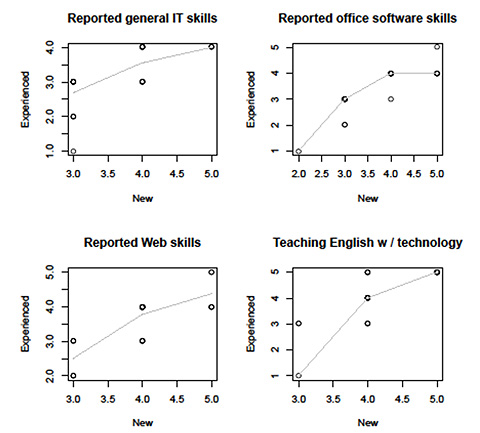
Figure 2: Reported IT skills by group (“new” and “experienced”), with added non-parametric regression lines. [ii]
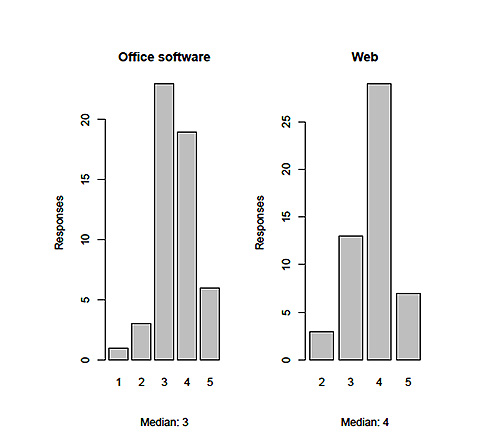
Figure 3: Student teachers are more confident in their Web skills than in their office-type software skills. [iii]
The hypothesis to be tested was that the more experienced students held the use of electronic resources in teaching in higher regard than the less experienced students. Although there was a clear age difference between the groups, it seems unlikely that this difference would be large enough to give rise to any general age-related differences in attitude to, or skills in, computer use. For all practical purposes these students must be considered to belong to the same age cohort with respect to their E-savviness. Consequently, it was predicted that any differences that might arise between the two groups would be due to the more extensive training which the more experienced students had received during their enrollment in the teacher training program.
Three parallel strategies were pursued in trying to measure the differences between the two groups with respect to attitudes and self-reported skills. First, initial testing for group differences was carried out by means of standard statistical tests for differences between groups or conditions with respect to IT skills. Second, ordinal regression was used to estimate the influence each variable had on attitudes toward teaching with technology. Finally, a visualization technique called Multidimensional Scaling (MDS) was used to reduce the variation in the dataset to a two-dimensional plot of distances, which essentially clusters responses together based on shared characteristics including ratings and variables. See Venables and Ripley (2002) for details on these two latter methods. All statistical tests were computed with the open-source statistical software package R (R Development Core Team, 2010), using general functions and the following user-supplied libraries: Design (Harrell, 2009); MASS (Venables & Ripley, 2002). In all statistical tests, the conventional alpha level of 0.05 was used to determine statistical significance.
Possible differences in IT skills and attitudes
Figure 2 indicated that the two student groups on the whole rated their IT skills similarly. This impression is supported by a Friedman rank sum test showing that the differences between the two groups in terms of the three types of self-reported IT skills (general, office-software, and Web) are not significant (Friedman = 3.71, p = 0.16) . The lower right plot of figure 2 furthermore suggests that the two groups of students do not differ in their attitudes toward teaching English with technology, and this is supported by the non-significant result of a Wilcoxon / Mann-Whitney test (W = 320.5, p = 0.74). Despite this lack of group differences, it would appear from figure 2 that office type IT skills are rated lower by all students. Figure 3 plots the overall ratings of office type and Web skills, respectively. It seems clear from the plot that students rate their office software IT skills lower. This difference (tested for Web-skills and office-type skills) was found to be statistically significant with a Wilcoxon signed rank test for paired samples (V = 334, p = 0.02). Hence it seems warranted to conclude that, contrary to the initial hypothesis, new and more experienced students do not differ in their reported IT skills, but that all students in the sample are less confident in their office software skills in they are in their other IT skills.
Predicting attitudes: Ordinal regression
Despite the lack of differences between the two student groups with respect to IT skills and attitudes toward teaching English with technology, there might be other sources of variation in the data. Two such sources are age and sex. The age of respondents ranges from 18 to 47, and 44 out of the 52 respondents are female. Although it would be possible to conduct a number of separate hypothesis tests on these variables with respect to attitudes toward teaching with technology, it is no desirable for two reasons. First, several related tests on the same data would increase the risk of spuriously significant results. Second, it would be interesting to investigate whether all these variables interact or influence each other in systematic ways, while at the same time measuring their correlation with attitudes to teaching with technology. To achieve this, an ordinal regression model was used to estimate the effect of the variables Study program, Age, Sex, General IT skills, Web skills, Office software skills, Hours spent using a computer, on attitudes to teaching English with technology. Although some of these variables were shown to be uncorrelated with the attitudes in isolation, they were included in the model to estimate any potential interaction effects between them.
The dependent variable in the model was the self-reported attitudes to teaching English with technology. These were ratings on an ordinal scale, and the model calculated the odds that the attitude of a given respondent was a given rating or higher, based on a linear combination of the independent variables, or predictors, mentioned above. The model indicated that none of these variables were statistically significant, i.e. that despite having information about all or any of these variables, the model does no better at predicting the students’ attitudes to teaching with technology than it would if it had been guessing at random. Furthermore, there were no significant interaction effects between any of the variables. This strongly suggests that there are no systematic correlations between any of these variables and attitude towards teaching English with technology among the students in the sample.
The full picture: Multidimensional scaling
The conclusion in the previous paragraph is further strengthened through a multidimensional scaling (MDS) map. MDS is a technique for reducing the variation among observations on an ordinal scale to a structure which is suitable for representing as points in a two-dimensional plot, allowing us to interpret distances between points. Figure 4 shows an MDS map for the two groups of students with respect to the three categories of IT skills, as well as attitudes toward using technology in teaching English, as well as in teaching in general (the number of hours spent on computer use was removed to ensure a better representation). As the plot clearly shows, the two groups are more or less identical, despite some outliers. Had there been systematic differences between the groups, they would have formed separate clusters in the plot. The structure revealed in figure 4 indicates that for all practical purposes the two groups are identical with respect to attitudes and self-reported skills.
Interim summary
The present section has demonstrated that there are no discernable differences in skills and attitudes between the two groups of students. Despite both a significant difference in the time spent in the teacher training program and some differences in the aims of the programs (primary school only versus primary and lower secondary school), the two groups of students consistently rate teaching English with technology as something positive, and they consistently rate their office software skills lower than other IT related skills. Possible confounding factors such as age, sex, or hours spent using a computer were not found to be significant predictors of student attitudes. The MDS map in figure 4 shows that despite their differences, the new and the more experienced student groups overlap to such an extent that it is not possible to distinguish them based on attitudes to teaching English with technology or self-reported IT skills. Based on this, it seems that the initial hypothesis, namely that the more experienced students have heightened their skills in and attitudes to teaching with technology, can be rejected. This conclusion is based on several different statistical techniques, which suggests that the results are reliable. However, a significant difference was found with respect to self-reported IT skills: all students tended to rate their office software skills lower than their Web skills. The next section will consider the effect of the experiment involving demonstrating Web-based software to the students.
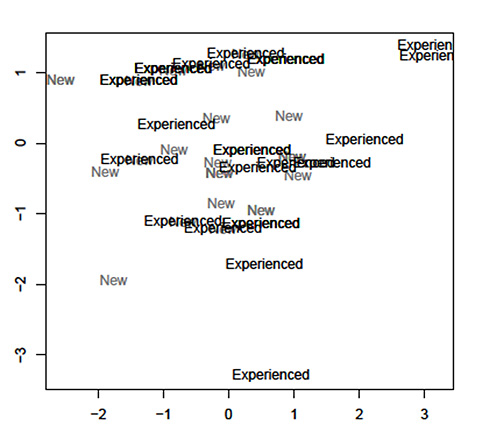
Figure 4: MDS map showing the two groups of students (“New” and “Experienced”) with respect to self-assessed E-skills and attitudes towards using E-resources in teaching. [iv]
The other main question this study attempted to answer was whether the students might change their attitudes towards teaching with technology if they were given a demonstration of such resources in use. Such an effect would not be entirely unexpected, as it could be a learning effect. Of course, it would be naïve to expect attitudes (the phenomenon being measured) to change in the course of one lecture. However, it does reflect fairly well the actual teaching conditions. Time is always at a premium in teaching, and it is not uncommon for a lecturer to only have one or two lectures at his or her disposal to cover a given topic. Hattie (2009, pp. 220-221) reports an average medium sized learning effect of computer assisted instruction which is unrelated to the duration of the instruction itself. Hence, the learning effect (if any) of an exposure to a single, brief instance of E-learning is not entirely unrealistic, nor is it without interest.
After the student teachers had completed the first part of the survey (reported on above), they sat through a teaching session on English political and social history. The session consisted of the following elements: a brief traditional, introductory lecture, a set of tasks related to English history for in-class work in pairs, and finally a demonstration using online data and software. The intention behind the demonstration using online data was two-fold. The first goal was to use available statistical data as a means of teaching English history. Although numbers might seem dry, they do provide a valuable and interesting complement to prose narrative as a source of information about the past, if presented in an appropriate way. Furthermore, reading and creating graphs and working with numbers are skills that are now integrated in several subjects in the LK06, including English (Ministry of Education and Research, 2006). The second aim was to investigate whether such a demonstration might positively influence attitudes toward using teaching English with technology.
For the purposes of this demonstration, a website was constructed displaying an animated graph which maps the relationship between population size, wheat prices, and wages for two different groups of workers in England between 1259 and 1750. The raw data for this demonstration are freely available from a website maintained by the Dutch International Institute of Social History(http://www.iisg.nl/hpw/data.php). The software for creating the animated graph is a freeware implementation of the “bubbleplot” software created by the Gapminder organization for displaying health and economics data (http://www.gapminder.org/world). The original Gapminder data can only display the data already entered into their databases. However, the Google Docs office suite supports a freeware implementation in the form of plugin to their spreadsheet software. With this web-based software it is fairly easy to create such animated graphics for any dataset and to publish it on the Web. Figure 5 shows a screenshot of the graph. The full animated graph created for the purposes of the current study can be accessed at http://home.hib.no/ansatte/gbj/population.htm.
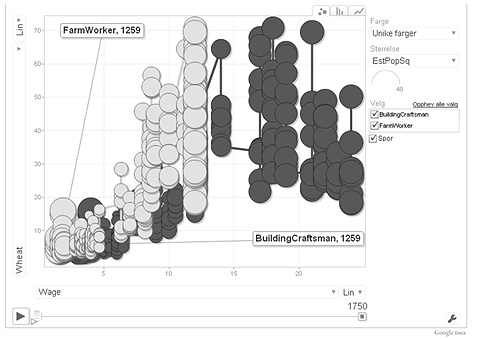
Figure 5: Screenshot of an animated graph displaying the interaction between population size, wheat prices, and wages for two categories of employees (farm workers and building craftsmen) in England between 1259 and 1750. [v]
After the presentation, the students were asked to turn their survey sheets and complete the remaining questions. The questions concerning attitudes towards teaching with technology were identical to those on the front page. The mean ranks suggest a small increase both for the more experienced students (before: 4.15, after: 4.31) and for the new students (before: 4.19, after: 4.35). However, the difference between the two groups is not statistically significant as measured with Friedman’s rank sum test (Friedman = 2, p = 0.16), which suggests that if any learning effect takes place, it is too weak to be objectively distinguished from other sources of variation in the data. One possible interpretation of the results is that the students considered the software and the data irrelevant with respect to teaching English with technology. Another plausible explanation could be that the students exhibited a highly positive attitude towards computer teaching with technology even before the demonstration; consequently, there was simply very little room for influencing attitudes further. However, a third possibility is that the students were unsure about the skills needed to use the software that was demonstrated. As previously demonstrated, the students consistently rated their office software skills lower than their Web skills. Since the graph software required precisely those kinds of skills (working with spreadsheet data), it is possible that the students found the specific approach that was demonstrated less appealing than other resources for teaching with technology.
The present study has shown that, with respect to teaching English with technology, there are no differences in attitudes and skills between student teachers in their first semester and those in their third or fourth year. Nor do the students differ with respect to their self-reported skills. Furthermore, it was shown that simply demonstrating Web resources does not significantly affect the students’ attitudes. One reason for this, as discussed above, could be that the students already are very positive to using technology in teaching, both in general and in teaching English. As such this is a positive result, because it indicates that these future teachers are highly motivated for computer assisted teaching. However, the results also raise some concern. As pointed out above, there are no significant differences between the more experienced and the less experienced students, both with respect to attitudes and, crucially, skills. Furthermore, the data above clearly showed that while the students were confident in their Web skills, they were less certain about their ability to handle office-type software. It is precisely the latter set of skills that will enable them to e.g. make animated graphs using Google Docs, use word-processing software efficiently, or even make the most out of presentation software. While it should be kept in mind that the present study is based on a small sample which might not be representative of all Norwegian student teachers of English, the results are nevertheless robust, having been arrived at through a number of different statistical methods.
The fact that Web surfing has become an everyday activity does not mean that a lack of relevant IT skills is no longer a factor that prevents the use of teaching with technology. Some of these practical difficulties with IT experienced by teachers are discussed in e.g. Rimmereide, Madsen, Husøy, Gjøvik, and Ekker (2009), who report that some teachers were frustrated by technical problems. Interestingly, Hattie (2009, p. 223) reports large gains in learning effect sizes when teachers have received training in using computers as teaching and learning tools, which further indicates that the question of teachers’ IT skills is still something that merits attention. Although the present study is small, it ties in with these previous studies in that it points to a possible gap in the teacher training curriculum. The students are highly positive to teaching with technology; however, while they assess their Web skills as being fairly good, they have less confidence in their office software skills.
The Web provides a rich source of data and presentation modes, as the animated graph of historical English data used in the study attests to. However, for student teachers to fully benefit from such possibilities and integrate them into their teaching, they require confidence in their own skills to work with office software, such as Google Docs. The results discussed in the present study suggest that the future teachers would benefit from more extensive training in the use of office software, which will allow them to bring both specific and general IT skills to bear on their positive attitudes to teaching with technology.
Dudeney, G., & Hockly, N. (2007). How to Teach English with Technology. Harlow: Longman.
Harrell, F. E. (2009). Design: Design Package. Retrieved from http://CRAN.R-project.org/package=Design. Accessed 01.11.2010.
Hattie, J. (2009). Visible learning: a synthesis of over 800 meta-analyses relating to achievement. London: Routledge.
Lund, A. (2009). Å være digital i engelsk. In H. Otnes (Ed.), Å være digital i alle fag (pp. 87-104). Oslo: Universitetsforlaget.
Ministry of Education and Research. (2006). Knowledge Promotion. Retrieved from http://www.udir.no/Artikler/_Lareplaner/_english/Knowledge-promotion---Kunnskapsloftet/. Accessed 01.11.2010.
R Development Core Team. (2010). R: A Language and Environment for Statistical Computing. Vienna. Retrieved from http://www.r-project.org. Accessed 01.11.2010.
Rimmereide, H. E., Madsen, T. G., Husøy, G., Gjøvik, Ø., & Ekker, S. (2009). Digitale mapper og konsekvenser for læringsmiljø i høgere utdanning. In H. Haugen (Ed.), Læringsmiljø på nett: Erfaringer fra forsøk og prosjekt (pp. 231-247). Trondheim: Tapir.
Venables, W. N., & Ripley, B. D. (2002). Modern Applied Statistics with S (4. ed.). New York: Springer.
[i] Each point corresponds to a student, and the bubble around each point is proportional to self-reported computer use (hours) in the week preceding the survey. The two outliers with respect to age (18 and 47, respectively) do not change the general conclusion: there is no significant correlation between age, amount of PC use, and attitudes toward teaching English with technology.
[ii] The horizontal axis shows “new” students, the vertical axis shows the “experienced” group. Similar ratings show up as straight lines. No clear group differences present themselves, but office-type skills appear to have lower ratings. The lower right plot shows reported attitudes to teaching English with technology by group.
[iii] The vertical axis shows the number of respondents, the horizontal axis shows the self-reported skill level, from 1 (very poor) to 5 (excellent). The difference is statistically significant with a Wilcoxon signed rank test for paired samples (V = 131,
p = 0.02).
[iv] Each label corresponds to a respondent; labels in the same position on the map are printed on top of each other. As the map clearly shows, there is an almost complete overlap between the new and more experienced students. The two-dimensional representation is fairly good, with a Kruskal stress value of 12.16%.
[v] The full animated graph can be accessed at http://home.hib.no/ansatte/gbj/population.htm.