Associate professor and reader of Chemical Technology
Department of Chemical and Environmental Engineering
University of Nottingham
E-mail: edward.lester@nottingham.ac.uk
Director of Human Computer interaction
Department of Computer Science
State University of New York
E-mail: schofield@cs.oswego.edu
Associate professor
School of Psychology
University of Nottingham
Email: Peter.Chapman@nottingham.ac.uk
An experiment undertaken with engineering undergraduate students at the University of Nottingham involved 26 groups of three being filmed during a study using a virtual-reality-based problem-solving exercise. After the exercise, each individual filled in a questionnaire relating to the exercise which allowed them to score themselves and their peers for contribution and overall grade. The comparing of video evidence with perceived contributions made it possible to observe patterns of behaviour based on temperament dominance. This ‘dominance’ was based on two simple parameters extracted from an electronic version of the Myers-Briggs test: first, the time taken to complete the study, called ‘decisiveness’, and secondly, the degree of Extroversion/Introversion. The more decisive subjects received higher marks from their peers, despite the absence of any video evidence that they had actually contributed more than their peers. The most dominant extroverts appear to ‘do more’ with respect to the physical operation of the mouse/keyboard and interaction with the visual simulation during the virtual-reality exercise. However, there was no link with these simple temperament measures with the degree of enjoyment of the tasks, which appeared to be highly consistent. The authors do not argue that visual-media tools, such as the virtual-reality environment described in this article, might offer solutions to problems associated with group work in engineering, but rather that information regarding the character traits of the participants may help to create more effective teams and to help understand the inter-personal dynamics within teams undertaking such tasks.
E-learning is increasing across all sectors of higher education, including engineering, where implementation can augment and enhance a range of student learning experiences (Rosenberg, 2000; Littlejohn, 2004; Bates, 2005; Felder & Spurlin, 2005). Past examples have included visual tools to help familiarise students with lab procedures, software to enhance communication in small groups, technology to facilitate feedback, etc. The authors have previously published papers detailing a number of application areas and uses of virtual environments in chemical-engineering education (Schofield et al., 2005; Lester et al., 2006). However as these learning technologies mature and become more graphically sophisticated, their potential for integrated learning and assessment becomes more real (Topping, 1998; Mohan & Brooks, 2003). Assessment may come from the learning technology itself, with the correct submission of answers or procedures, but may also come from self and peer assessment. If this is the case, understanding how users interact with visual e-learning environments, alongside their peers, becomes important (Hanrahan & Isaacs, 2001). If the package involves group work, how does one assemble a group? Are there techniques for putting a group together that can establish good practice for stand-alone practical sessions?
Devising methods of assessment that are fair to individual students, without imposing unmanageable burdens on the time of staff, can be a big challenge. A number of researchers have reported that students are over-assessed and apportioning marks for group efforts can sometimes be difficult and inaccurate (Gatfield, 1999; Shepard, 2000; Willis? et al., 2002). Peer and self assessment can sometimes be problematic and therefore these methods are rarely used in a summative context (Somervell, 1993; Topping, 1998; Dochy et al., 1999). However, visual technologies such as the virtual environment described in this paper could be part of the answer to the problematic, recurring issue of over-assessment whilst strengthening the learning experience of the student (Mennin & Kalishman, 1998; Swanston et al., 1998,). The context of self and peer assessment is critical when reviewing successes and failures. If group-work occurs over a period of weeks there is usually the opportunity for academics to monitor the peer-review process and foster good practice (Stanier, 1997; Sluijsmans et al., 1998; Elliott & Higgins, 2004). However, there may be situations in which assessment needs to be more immediate, where marks are attributed in a single sitting, for example, after a practical or laboratory experiment. Many e-learning activities could be included in this category of ‘fire-and-forget’ sessions, and it is in these situations where confidence in the marking system is often needed.
The authors have been particularly interested in establishing whether it is possible to use simple electronic temperament tests to formulate groups for visually focused e-learning work. ‘Simple’ can defined as simple questions that require neither high standards of English nor any prior knowledge about psychometric evaluation.
There are several standard tests used by companies for assessing ‘temperament’ (Plomin & Dunn, 1986; Wiggins & Pincus, 1992; Furnham, 1997; Asher, 2007). Classic tests include the Kolbs Learning Styles(Willcoxson, L. & Prosser, M., 1996), Gardner’s Multiple Intelligences (Gardner, 1993 and Gardner, 2006), FIRO-B Personality Assessment Model (Furnham, 1996), VAK learning styles model (Vincent & Ross, 2001), The Big Five (45 questions on a sliding scale of 1 to 5) (Busatoa et al., 1998), Myers Briggs (70 questions answered a or b) (Myers & Myers, 1977; Myers & McCaulley, 1985), The TCI test (240 questions, answered yes or no) (Agrell & Gustafson, 1994; Kivimaki et al., 1997), and Belbin’s Team Roles (Belbin, 1993; Fisher et al., 1998).
There are several overlaps in the traits that each test assesses (Furnham, 1997; Asher, 2007). For example, most will measure degree of extrovert/introvert tendency. The Big Five Test (Busatoa et al., 1998) measures Extraversion, Openness, Agreeableness, Conscientiousness and Negative Emotionality (neuroticism). These parameters are measured on a sliding scale where a ‘poor score’ means that the subject is not, for example, highly ‘Open’. Myers-Briggs (Myers & Myers, 1977; Myers & McCaulley 1985) also measures Extraversion as a tendency to be more Extrovert or Introvert (resulting in an E or I notation, respectively). One criticism of the Myers-Briggs test, compared to the Big 5 Test (Srivastava et al., 2003), is that the results are bi-modal, that is, a person is deemed to be either extrovert or introvert, etc. However, it is clear that most people are not bimodal and can demonstrate a more complex set of behaviours (Wiggins & Pincus, 1992; Asher, 2007).
The Myers-Briggs test uses 70 questions to gauge Extraversion and Introversion (10 questions), Intuition to Sensation (20 questions), Thinking to Feeling (20 questions) and Perceiving to Judging (20 questions). The authors were particularly interested in the first question because it is the most common trait, measured, to some degree, by all other tests.
The use of the data from the 70 questions that form the Myers-Briggs test was important for this study, since it was presented to the study participants as an e-Version. In this study we recorded the response times and answers to every individual question. In this way it was possible to apply a ‘strength-of-response’ measurement to each of the traits based on a correlation between the time to answer and the answers to the 70 questions in the questionnaire. If a long time was taken for a response, then the subject could be considered to be ‘hesitating’. A quick answer could be taken as a ‘decisive’ response (Lester et al., 2006). Combining the times and answers allows each subject to be ranked against their team partners in terms of ‘dominance’. This combines the ideas of Myers-Briggs with the sliding scale style result of the Big Five.
Since the average engineering student is an introverted thinker (McCaulley, 1990), expressiveness and co-operation during group work is not necessarily a natural mode of learning for them (McCaulley, 1987; Wankat & Oreovicz, 1993; Elliott & Higgins, 2004). As a result there are a number of problems with group work in engineering education (Felder et al., 2002), relating to how groups are put together from a pool of individuals and how the output from each group can be assessed effectively (Felder & Spurlin, 2005; Lejk & Wyvill, 2001).
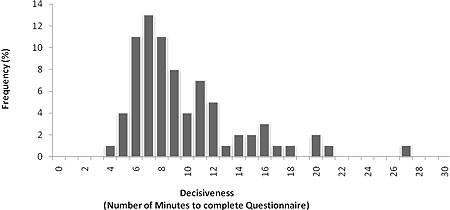
It should be emphasised that the authors are not seeking to validate or compare the relevance of the Myers-Briggs test with behaviour. There are many different personality tests and each has advocates and critics. This exercise was based around correlating the use of a simple psychometric test and any detectable behavioural patterns in group work, particularly peer and self assessment. Extraversion and decisiveness were the two specific parameters used in this study. The time taken to answer the questions was labelled ‘decisiveness’, since it is fair to say that the ability of the subject to make decisions based on a simple question (a or b) has to denote some level of decisiveness (Laruelle & Valencianon, 2005). Figure 1 shows the distribution in ‘decisiveness’ from the subjects in the study. There is a wide distribution from four minutes to 27 minutes. The main group of students were around four to 10 minutes. A second grouping lasted around 10-13 minutes and another from 14-20 minutes.
Figure 1 – the spread of decisiveness across the 78 participants
Since, in the standard Myers-Briggs Test, there is a total of 10 questions relating to ‘Extroversion’ and ‘Introversion’, eight responses towards Extraversion and two for Introversion would, for example, indicate a high ‘strength’ towards Extraversion. Four introvert responses and six for extroversion indicate weak Extraversion. Figure 2 shows how this strength of response can be applied to the data from each individual. In a group of three, there might be three extroverts, or three introverts, but the level of extroversion or introversion will vary. With the three introverts, one will likely be ‘less introverted’ than the other two, and this is where relative extrovert dominance may occur. It is possible also that whoever is the most “X” (X being a measurable character trait) dominates the group, regardless of the ‘strength’ of the trait on an absolute basis, but simply on a relative basis within any given group.
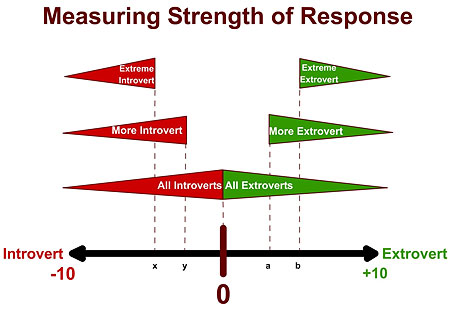
Figure 2 – The sliding scale of strength of response for the 10 I/E questions
Rather than focusing specifically on the relevance or rigour of a particular temperaments test, this study is focused on investigating whether a virtual learning environment could be used as a simple test that could be adopted and that could give measurable results which could be related to trends in actual group behaviour. This paper describes a group based, e-learning experiment involving a set of virtual-reality tasks that are completed with self and peer assessment. This experiment was carried out to identify how students perceive themselves and the other members of their group with respect to contribution and whether any simple character traits have a specific bearing on the way they allot these marks. If marks were to be summative, then some conclusions could be drawn as to how these marks were affected by the personality traits of the ‘assessor’ and the ‘assessed’. The authors do not argue that e-learning tools, such as the virtual-reality environment described in this paper here, might offer solutions to problems associated with group work in engineering, but that information regarding the character traits of the participants may help to create more effective teams and to help understand the inter-personal dynamics within those teams.
The exercise was devised in the form of a game scenario with virtual-reality tasks taking place on board a space station. In the experiment, 26 groups of three were assembled and each team was asked to solve the eight tasks as quickly as possible within a maximum time limit of one hour.
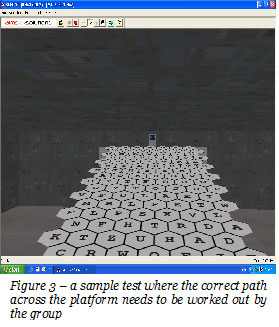
Within the virtual environment each of the tasks required different skills, some required a computer-games-like dexterity (for example, traversing a set of floating platforms or shooting at targets), some required memory and planning (for example, navigating through a maze, an example of which is shown in Figure 3) and some required creativity and intuition (for example, manipulating abstract shapes to create a letter or number form, an example of which is shown in Figure 4). The rationale behind this virtual-reality environment was to create a number of different, location-specific tasks, each requiring different skills to solve, which users could complete individually or as part of a team. Hence, the dynamics of how the users interacted with each other and which team member performed which function could be monitored and recorded.
As the users entered the Red Planet virtual environment they received the following instructions:
“You are currently situated in a bunker on a red planet. Outside there are 6 rooms and a maze. Within each room is a puzzle for you to solve. If you solve the puzzle correctly you will be given either an operator or a number.
There are a total of 3 of the 4 operators (i.e. +, -, /, or x) and 4 numbers (all between 1 and 9). Collect all operators and numbers and rearrange them to solve your given equation. This will be the last of 8 separate tasks”
The users then navigated their viewpoint around the world, entering the rooms in which the tasks were located and receiving detailed instructions for each task. Upon completion of these tasks the users received a series of numbers and arithmetical operators which they manipulated to form a complete, mathematically correct equation.
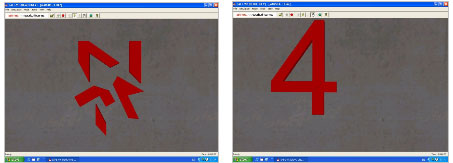
Figure 4 – a number puzzle where the groups must assemble or guess the number from the fragments
Each group was recorded on video during the exercise in order to analyse and assess the interaction of the individuals, the dynamics of the groups as a whole and the type of contribution made by each individual. One section of the analysis form used to ‘code’ each group is shown in Appendix A.
After each session was completed, either by finishing the tasks or by reaching the one hour time limit, each student was asked to assess their perceived level of input as well as that of their peers. A copy of the participant questionnaire is included in Appendix B.
Using the video evidence and the assessment forms, the overall performance of the group and the degree of contribution from each member was quantified and compared.
It was also possible to consider the behaviour of individuals on a group-by-group basis, which might also yield interesting trends; for example, if a highly extroverted student was placed with two other highly extroverted students, the group interaction might not be any different from a group with three strong or moderate introverts.
The results for the group metrics and awarded scores (self and peer assessment) are given in Tables 1 and 2, respectively. The consistencies across both tables are the most noticeable feature. The least dominant character tends to make far fewer ‘non-related’ comments during the exercise. All appeared to enjoy the task at hand, however. The only significant difference in the groups (Table 2), when ranking the most and least ‘decisive’ character was the way that marks were allocated. The most dominant characters were very consistent in the marks given to themselves and to the other two less dominant members of the group. The next most dominant appears to be equally as consistent. The least dominant however, awards significantly more marks and contributions to the other two members of the group, for example, 28.7 per cent contribution awarded to self compared with 35.3 per cent and 36.0 per cent to peers. The same is seen with mark allocation at 55.6 per cent to self and 62.2 per cent and 62.9 per cent for peers. The participants do not feel they have done (or earned) more than their peers. This is supported by video evidence (quantified in Table 1) but in contrast to the assessment of their peers, which shows some variations in allocation of marks and contributions. The most dominant characters appear to value the least dominant, marginally more highly than themselves, even though the least dominant ones clearly do not.
‘Indecisiveness’, as the opposite of ‘decisiveness’, has been shown to be a measurable trait in younger people (Germeijs et al., 2006). Clearly there are those who can make decisions more rapidly than others (Ream, 1922) and the key issue is around the relationship between these more ‘mobile’ or ‘rapid-fire’ types and the more ‘deliberate’ types. In this exercise, there were multiple challenges and multiple strategies for tackling each problem. Most of these challenges allowed the authors to monitor and record decisive acts that were performed by the users. For example, figure 4 shows one of the object-manipulation problems the users were faced with; some of the groups guessed at the number without attempting to reorganise the shapes, while other groups would spend inordinate amounts of time manipulating the objects, to prove that the shape was indeed the number four. How a group decides to adopt either strategy, or switch from one to the other, is made by a mutual (team) or non-mutual (individual) decision, and this requires a choice to be made, at some stage in the process.
Figure 5 shows the distribution profile for introversion/extroversion across the group of participants. Based on this figure, there is clearly a bias towards extroversion, rather than introversion, which is at odds with other studies on engineering students. The other finding is that the study did not involve any extreme introverts.
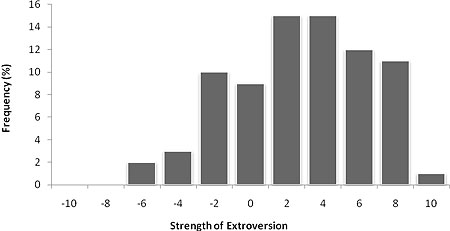
Figure 5 – the distribution of Extrovert/Introverts in the study group.
The most extrovert member of each group appears to carry out more actions at 39.0 per cent compared to 30.4 per cent and 31.0 per cent (Table 3). Interestingly, total utterances appear to be consistent through each group although the most dominant extrovert appears to make significantly more unrelated comments during the exercise. It is possible that this is reflects the nature of the exercise, where there is time for reflection during the problem-solving sections.
Enjoyment of the exercise and the virtual-reality task as a whole appear very consistent (Table 3). All three members of each group consistently award marginally higher marks to peers irrespective of whether they are more or less extrovert. It is possible that the least dominant extrovert could also be classed as the most dominant introvert, hence it is possible to say that many of the differences between E and I within each group are marginal.
The success or outcome/consequence of these virtual tasks can impact the stimuli of introverts (Grey et al., 1983). There have been a number of interesting previous studies on the effects of extroversion and introversion in group work (Buckingham, 2002). Links have been made to temperament and physiological arousal during such exercises, as measured by skin conductance and heart rate (Davis, 1988; Robinson 2001). There is also some evidence the more dominant introverts are more easily fatigued and struggle to concentrate on external based tasks (like group work) for extended periods of time (Helmers et al., 1997; Goldberg, 1993). The implication from this research is that the length of the whole task could be crucial in determining the success of the group-work exercise. If a task is set that becomes too lengthy, it is possible that the dynamic of the group will deteriorate simply because the focus of the individuals on the visual task will reduce at different rates.
From Table 4, a number of interesting observations can be made. The most extroverted characters in the groups did not appear to score themselves more highly than their two, lesser extroverted, peers. In fact, the most dominant member of the group consistently valued the other two members as more significant. The least extrovert awards consistent marks, whilst acknowledging that the other members 'did more'. It is possible that this table shows that the most extrovert character is able to value the contributions of the more 'deliberate' members of the group. The contributions made by each individual can be quantified (Table 3) but these contributions are made as a result of what might be described as 'covert cognitive operations' (Boddy et al., 1986). The covert, or hidden, nature of many of the cognitive operations performed during the experiment precludes unequivocal attribution of superior task performance to the application of external stimuli. As such, this makes it difficult to prove whether there is evidence to support Gray's theory that extraverts are differentiated from introverts by their response to positive and negative stimuli – namely, successes and failures during the exercise (Gray 1970).
It is concluded that, although findings appear to support J. A. Gray's theory that extraverts are differentiated from introverts by a reversal in the balance between behavioural activation and behavioural inhibition systems, the covert nature of the cognitive operations precludes unequivocal attribution of superior task performance in negatively reinforced introverts to the accentuated excitation of the Behavioural Inhibition System (BIS).
This article has described an experiment where 78 engineering students undertook a series of tasks in a virtual-reality environment in teams of three. Each participant underwent a psychometric evaluation using a Myers-Briggs test and an additional measure of decisiveness based on the time taken to complete the test. As the groups undertook the visual-media experiment their actions and communication were monitored on video and these actions were later coded and measured. Upon analysis of these results there are some clear behavioural trends with respect to marks allotted to self and peers.
Decisiveness (not a function in the Myers-Briggs test) appears to be an influence in the assessment but not in the activity within the virtual world, apart from the relatively superficial activity of unrelated utterances. Decisive people award marks evenly, but the least decisive in a group context tend to award more marks to their more decisive team members.
The way a group is configured appears to affect dynamics and behaviour as well as the assessment and recognition of contribution. This poses some difficult questions, not just about group work which utilises visual-learning media, but also about the reliability of self/peer assessment in a group context. This will require further thought and development.
Although a number of conclusions and trends were seen in the data regarding how different team members performed and assessed each other, it should be noted that some of the measured quantitative differences were small and hence can only be used to indicate trends rather than draw strong conclusions.
The length of the task set in the virtual environment could well have an impact on the success of such group exercises. Clearly, introverts and extroverts work differently in relation to internal and external stimuli, and in their responses to the visual media presented to them. The ability to focus and concentrate on the task at hand is crucial, particularly where peer and self assessment is required. There is some evidence to suggest that temperament influences focus.
If members of a group appear to lose interest then the scores or contributions that they will receive from their peers will probably not reflect their overall input, but be skewed by their final level of engagement. It is possible that the dynamic of the group will deteriorate simply because the focus of the individuals on the learning media will reduce at different rates. It would be wise to take this eventuality into account when designing visual e-learning exercises for groups, ensuring that ample time for breaks are planned to ensure that all temperament types within the group can remain focused.
The authors believe that the findings of the experiments described in this paper have relevance to the design and use of a range of visual tools for students of engineering.
Agrell, A. & Gustafson, R. (1994). The Team Climate Inventory (TCI) and group innovation: A psychometric test on a Swedish sample of work groups. Journal of Occupational and Organizational Psychology, 67(2) 143-151.
Asher, I. E. (2007). Occupational Therapy Assessment Tools: An Annotated Index. Bethesda, MA: AOTA Press.
Bates, A. W. (2005). Technology, Distributed Learning and Distance Education (Studies in Distance Education). London: Routledge.
Belbin, M. (1993). Team Roles at Work. Oxford: Butterworth-Heinemann.
Boddy J., Carver A., & Rowley K. (1986). Effects of positive and negative verbal reinforcement on performance as a function of extraversion-introversion: Some tests of Gray's theory. Personality and Individual Differences, 7(1), 81-88.
Buckingham R.M. (2002). Extraversion, neuroticism and the four temperaments of antiquity: an investigation of physiological reactivity. Personality and Individual Differences, 32(2), 225-246.
Busatoa, V. V., Prinsb, F. J., Elshouta J. J. & Hamakera, C. (1998). The relation between learning styles, the Big Five personality traits and achievement motivation in higher education. Personality and Individual Differences, 26(1) 129-140.
D’Cruz, M. (2001). Structured evaluation of training in virtual environments. Ph.D. Thesis, University of Nottingham
Davis C. (1988). Reliability of psychophysiological assessment within temperament groups. International Journal of Psychophysiology, 6(4), 299-305
Dochy, F., Segers, M. & Sluijsmans, D. (1999). The use of self-, peer and co-assessment in higher education: A review. Studies in Higher Education, 24(3), 331-350.
Elliott, N. & Higgins, A. (2004). Self and peer assessment – does it make a difference to student group work? Nurse Education in Practice, 5(1) 40-48.
Felder, R. M. & Spurlin, J. (2005). Applications, reliability and validity of the index of learning styles. International Journal of Engineering Education, 21(1), 103-112.
Felder R.M., Felder G.N., & Dietz E.J. (2002). The effects of personality on engineering student performance and attitudes. Journal of Engineering Education, 91(1) 3-17.
Fisher, S. G., Hunter, T. A. & Macrosson, W. D. K. (1998). The structure of Belbin's team roles. Journal of Occupational and Organizational Psychology, 71(3), 283-288.
Furnham, A. (1996). The FIRO-B, the Learning Style Questionnaire and the Five-Factor Model. Journal of Social Behaviour and Personality, 11(2), 285-299.
Furnham, A. (1997). The Psychology of Behaviour at Work. Hove: Psychology Press.
Gardner, H. E. (1993). Frames Of Mind: The Theory Of Multiple Intelligences. New York: Basic Books.
Gardner, H. E. (2006). Multiple Intelligences: New Horizons in Theory and Practice. New York: Basic Books.
Gatfield, T. (1999). Examining Student Satisfaction with Group Projects and Peer Assessment, Assessment & Evaluation in Higher Education, 24(4) 365-77.
Germeijs V., Verschueren K., & Soenens B. (2006). Indecisiveness and High School Students' Career Decision-Making Process: Longitudinal Associations and the Mediational Role of Anxiety. Journal of Counseling Psychology, 53(4), 397-410
Goldberg, L. R. (1993). The structure of phenotypic personality traits. American Psychologist, 48(1), 26-34
Gray, J.A. (1970). The psychophysiological basis of introversion-extraversion, Behaviour Research and Therapy, 8(3), 249-266
Gray, J. A., Owen, S., Davis, N. & Tsaltas, E. (1983). Psychological and physiological relations between anxiety and impulsivity. In M. Zuckerman (Ed.), Biological Bases of Sensation seeking, Impulsivity, and Anxiety (pp. 189-217).Hillsdale, NJ: Lawrence Erlbaum Assoc.
Hanrahan S. J. & Isaacs G. (2001). Assessing Self- and Peer-assessment: the students' views. Higher Education Research & Development, 20(1), 53-70.
Helmers, K.F., Young S.N., & Pihl R.O. (1997). Extraversion and behavioral impulsivity. Personality and Individual Differences, 23(3), 441-452.
Keirsey, D. (1984). Please Understand Me. Del Mar, CA: Prometheus Nemesis Book Co.
Keirsey, D. (1998). Please Understand Me II: Temperament, Character, Intelligence. Del Mar, CA: Prometheus Nemesis Books.
Kivimaki, M., Kuk, G., Elovainio, M., Thomson, L., Kalliomaki-Levantot & Heikkila, A. (1997). The Team Climate Inventory (TCI) : four or five factors ? Testing the structure of TCI in samples of low and high complexity jobs. Journal of Occupational and Organizational Psychology, 70(4) 375-389.
Laruelle, A. & Valencianon, F. (2005). Assessing success and decisiveness in voting situations. Journal of Social Choice and Welfare, 24(1) 171-197.
Lester, E., Schofield, D. & Chapman, P. (2006). The Interaction of Engineering ‘Types’: A Study of Group Dynamics and Its Relationship to Self and Peer Assessment During Computer-Based Exercises. Engineering Education: The Journal of the Higher Education Academy Engineering Subject Centre, 1(1) 39-49.
Littlejohn, A. (2004). Reusing Online Resources: A substantial Approach to E-learning (Open and Flexible Learning Series). London: Routledge.
McCaulley M.H., Godleski E.S., Yokomoto C.F., Harrisberger L., & Sloan E.D. (1983). Applications of psychological type in engineering education. Engineering Education, 73(5), 394-400.
Mennin, S. P. & Kalishman, S. (1998). Student Assessment, Academic Medicine, 73(9) 46-54.
Mohan, P. & Brooks, C. (2003). Engineering a Future for Web-Based Learning Objects, Lecture Notes in Computer Science (Web Engineering), 2722, 163-167.
Myers, I. & McCaulley, M. (1985). Manual: A guide to the development and use of the Myers Briggs Type Indicator. Palo Alto, CA: Consulting Psychologists Press.
Myers, P. B. & Myers, K. D. (1977). Myers-Briggs Type Indicator. Palo Alto, CA: Consulting Psychologists Press.
Plomin, R. & Dunn, J. (1986). The Study of Temperament: Changes, Continuities, and Challenges. Hillsdale, NJ: Lawrence Erlbaum.
Ream, M.J. (1922). Temperament in harmonious human relationships. Journal of Abnormal Psychology and Social Psychology, 17(1), 58-61.
Robinson, D.L. (2001). How brain arousal systems determine different temperament types and the major dimensions of personality. Personality and Individual Differences, 31(8), 1233-1259.
Rosenberg, M. J. (2000). E-Learning: Strategies for Delivering Knowledge in the Digital Age. New York: McGraw-Hill.
Schofield, D., Lester, E. & Wilson, J. A. (2005). Virtual Reality Based, Interactive E-Learning For Chemical Engineers. The 7th World Congress of Chemical Engineering, Glasgow, UK, 10th – 14th July 2005.
Shepard, L. A. (2000). The role of assessment in a learning culture, Educational Researcher, 29(7) 4-14.
Srivastava, S., John, O. P., Gosling, S. D., & Potter, J. (2003). Development of personality in early and middle adulthood: Set like plaster or persistent change? Journal of Personality and Social Psychology, 84(5) 1041-1053.
Sluijsmans, D., Dochy, F. & Moerkerke, G. (1998) Creating a Learning Environment by Using Self-, Peer- and Co-Assessment, Journal of Learning Environments Research, 1(3), 293-319.
Somervell, H. (1993). Issues in Assessment, Enterprise and Higher Education: The Case for Self-, Peer and Collaborative Assessment. Assessment and Evaluation in Higher Education, 18(3), 221-233.
Stanier, L. (1997). Peer Assessment and Group Work as Vehicles for Student Empowerment: A Module Evaluation. Journal of Geography in Higher Education, 21(1) 95-98.
Stuart, J., Benderson, B. B. & Druin, A. (1999). Single Display Groupware: A Model for Co-Present Collaboration, Proceedings of Human Factors in Computer Systems, ACM Press, pp 286-293, 1999
Swanston, D. B. Case, S. M. & van der Vleuten, C. P. M. (1998). Strategies for Student Assessment. In D. Boud & G. Feletti (Eds), The Challenge of Problem Based Learning (pp. 269-282). London: Routledge.
Topping, K. (1998). Peer Assessment Between Students in Colleges and Universities. Review of Educational Research, 68(3), 249-276.
Tromp, J. (2001).Systematic usability design and evaluation for collaborative virtual environments. Ph.D. Thesis, University of Nottingham.
Vincent, A. & Ross, D. (2001). Personalize training: determine learning styles, personality types and multiple intelligences online, The Learning Organization, 8(1) 36-43.
Wiggins, J. S. & Pincus A. L. (1992). Personality: Structure and Assessment, Annual Review of Psychology, 43, 473-504.
Willcoxson, L. & Prosser, M. (1996). Kolb's Learning Style Inventory: review and further study of validity and reliability. British Journal of Educational Psychology, 66(2), 247-257.
Willis?, S. C., Jones? A., Bundy?, C., Burdett?, K., Whitehouse?, C. R. & O'Neill, P. A. (2002). Small-group work and assessment in a PBL curriculum: a qualitative and quantitative evaluation of student perceptions of the process of working in small groups and its assessment, Medical Teacher, 24(5) 495-501.