Vol 10, No 2 (2026)
https://doi.org/10.7577/njcie.6513
Article
Post‑Pandemic Shifts in Teacher Professional Development, Practices, and Well‑Being Across Four Nordic Education Systems: Evidence from TALIS 2018‑2024
Kayode Moses Oluwafemi
National Research University, Higher School of Economics
Email: Oluvafemi.K.M@hse.ru
Abstract
This study examines post-pandemic changes in professional development, teaching practices, and well-being in Denmark, Finland, Norway, and Sweden using data from the Teaching and Learning International Survey (TALIS) 2018 and 2024. Drawing on the Job Demands-Resources (JD-R) framework and informed by governance typologies as a comparative contextual lens, the study uses a repeated cross-sectional design to compare indicators of professional development, teaching practices, job satisfaction, and work-related stress before and after the COVID-19 pandemic. The findings show distinct post-pandemic adaptation patterns across the four Nordic systems. Denmark combined reduced participation in professional development on core pedagogical competencies with increased participation in inclusive classroom practices, lower work-related stress, and improved job satisfaction. Finland experienced the sharpest decline in participation in core pedagogical competencies alongside rising work-related stress and lower job satisfaction. Norway substantially increased professional development but also recorded the largest increase in work-related stress and the sharpest decline in job satisfaction, suggesting that resource expansion alone did not offset growing demands. Sweden showed comparatively stable patterns, with modest increases in work-related stress and largely stable job satisfaction despite changes in professional development and classroom management practices. Interpreted through the JD-R framework, Denmark reflected gain-spiral resilience, Sweden equilibrium stability, Finland demand-expanding strain, and Norway loss-spiral vulnerability. Overall, the findings suggest that post-pandemic adaptation followed distinct patterns across the four Nordic systems and depended less on professional development alone than on how education systems balanced professional resources and work-related demands over time.
Keywords: Teacher Well-Being, Job Demands-Resources, TALIS, Resilience, Nordic Education
Introduction
The COVID-19 pandemic disrupted schooling worldwide, forcing teachers into emergency remote teaching, exposing digital access gaps, and intensifying concerns about learning loss and teacher well-being (Carrillo & Flores, 2020; OECD, 2020b; 2020c; Rapanta et al., 2021). Although early research documented these immediate challenges, less is known about how education systems adapted during the medium-term recovery phase (Avidov-Ungar et al., 2025; Nøkleby et al., 2024; OECD, 2021a; 2021b).
This study examines post-pandemic adaptation through the Job Demands-Resources framework, which explains how teacher well-being depends on the balance between work demands and available resources (Bakker & Demerouti, 2007; 2018; Bakker et al., 2023; Collie, 2023; Skaalvik & Skaalvik, 2018; Viac & Fraser, 2020). Within this framework, professional development is treated as a resource, whereas intensified instructional expectations and work-related strain are treated as demands that may shape teacher well-being over time.
Against this backdrop, the study uses a dual-track response perspective to examine whether education systems were able to contain rising demands while sustaining or expanding professional resources (Bakker & Demerouti, 2007; Viac & Fraser, 2020). Dual-track refers to the simultaneous management of two interrelated challenges: containing or reducing work demands (demand management) while maintaining or expanding professional resources (resource expansion) (Bakker & Demerouti, 2007). From this view, teacher well-being is more likely to be protected when workload pressures are managed alongside professional development, collegial support, and learning opportunities (Bakker et al., 2023; Collie, 2023). Understanding whether Nordic systems achieved this balance could reveal policy and structural mechanisms associated with teacher sustainability during the crisis (Avidov-Ungar et al., 2025; OECD, 2020b).
Nordic country background
Denmark, Finland, Norway, and Sweden provide a useful comparison because they share a Nordic commitment to equity and professionalism but differ in governance arrangements, school autonomy, and pandemic responses (Hall et al., 2022; Magnússon, 2020; OECD, 2025a; Sundberg & Hovdhaugen, 2026). The Nordic countries also varied in school closures and reopening paces during the COVID-19 pandemic, creating distinct recovery conditions (Hall et al., 2022; OECD, 2025a). Pre-pandemic TALIS evidence shows cross-national differences in professional development needs, ICT preparedness, and job satisfaction (Lähteenmäki et al., 2025; OECD, 2025b; 2025c; 2025d; 2025e; Wiksten, 2025). Collectively, these common commitments and institutional differences provide a strong comparative basis for examining post-pandemic adaptation across the four systems.
Against this background, the study addresses four research questions.
RQ1. How did Nordic systems reconfigure professional development between 2018 and 2024, particularly in equity-oriented domains?
RQ2. In which instructional domains did teaching practice intensify?
RQ3. How did work-related stress and job satisfaction evolve?
RQ4. Do well-being trajectories align with governance-based demand-resource expectations?
These questions are examined through comparisons of professional development, teaching practices, and teacher well-being across the four systems, and the Results and Discussion sections follow the same sequence.
Table 1 summarises the governance architecture, key characteristics, and pandemic policy approach for the four Nordic systems included in this study. These classifications are drawn from comparative accounts of Nordic education governance (Blossing et al., 2014; Buchholtz et al., 2020; Lennert da Silva, 2022; Sundberg & Hovdhaugen, 2026) and pandemic response analyses (Christensen et al., 2023; Hall et al., 2022).
Table 1. Governance Architecture, Key Characteristics, and Pandemic Response in Four Nordic Education Systems
|
Country |
Governance type |
Key characteristics |
Pandemic policy approach |
|
Denmark |
Framework-decentralised (Blossing et al., 2014) |
Centralised standards, municipal implementation, school-level decisions (Rasmussen & Moos, 2014) |
Moderate school closures; targeted remote learning (OECD, 2020a) |
|
Finland |
Autonomy-based (Ahonen, 2014) |
High school and teacher autonomy, trust-based governance, local curriculum flexibility (Chung, 2023; Haapaniemi et al., 2021; Sahlberg, 2015) |
Light-touch restrictions; rapid return to in-person teaching (OECD, 2025b) |
|
Norway |
Multi-level (Imsen & Volckmar, 2014) |
Shared authority: municipalities (lower secondary) and counties (upper secondary) (Frønes et al., 2020) |
Varied by region; municipal discretion (Hall et al., 2022) |
|
Sweden |
Market-driven (Dovemark, 2014) |
School choice, independent schools, national curriculum framework (Magnússon, 2020) |
No national closures; primary schools remained open (Christensen et al., 2023; OECD, 2025d) |
Literature Review and Theoretical Framework
This study builds on the JD-R framework and examines how Nordic education systems adapted to post-pandemic pressures through changes in professional development, teaching practices, and teacher well-being. The literature review is organised around five linked elements: the JD-R explanation of teacher well-being, the role of professional development as a resource, the conceptualisation of teaching practices, the dimensions of teacher well-being, and the analytical expectations that connect the literature to the comparative analysis. Collectively, these strands provide the conceptual basis for interpreting post-pandemic change across the four Nordic systems (Bakker & Demerouti, 2007; Bakker et al., 2023; Demerouti et al., 2001).
The JD-R Framework and Teacher Well-Being
The JD-R framework explains teacher well-being through the interaction between job demands and job resources. Accordingly, when demands intensify without adequate support, strain increases; when resources are available, they buffer pressure and sustain engagement (Bakker & Demerouti, 2007; 2018; Bakker et al., 2023). Recent studies demonstrate that teacher well-being is shaped by the interaction between demands and resources, including workload, classroom conditions, collegial support, autonomy, and professional learning opportunities (Casely-Hayford et al., 2022; Collie, 2023; Lähteenmäki et al., 2025; Viac & Fraser, 2020). Pandemic evidence shows COVID-related disruption intensified demands, making system support and resources more consequential for coping (Avidov-Ungar et al., 2025; Viac & Fraser, 2020).
Professional Development as a Resource
Professional development refers to teachers’ participation in formal and informal learning activities that build instructional knowledge, skills, and practice (Desimone, 2009). Effective professional development is typically content-focused, active, coherent, sustained, and collaborative (Darling-Hammond et al., 2017). Its breadth, or diversity of learning modalities, is a useful predictor of instructional change and complements time-based measures of intensity (Timperley et al., 2007). Within the JD-R framework, professional development functions as a job resource that supports teachers’ capacity to respond to changing instructional conditions, including digital teaching, inclusive pedagogy, and evolving classroom demands (Avidov-Ungar et al., 2025; OECD, 2025a; 2025b).
Teaching Practices and Job Demands
Teaching practices are conceptualized following the internationally validated TALIS teaching practices model (Klieme et al., 2009), which distinguishes three core domains: clarity of instruction, cognitive activation, and classroom management. These domains capture distinct yet complementary dimensions of teaching quality and are widely used in large-scale international assessments (OECD, 2019a; Wiksten, 2025). Through a JD-R lens, intensified instructional expectations may function as additional job demands when not accompanied by sufficient support, whereas teacher autonomy, collegial support, and access to professional learning help teachers manage such pressures more effectively (Bakker & Demerouti, 2017; Bakker et al., 2023; Collie, 2023; Lennert da Silva, 2022; Viac & Fraser, 2020). These instructional demands are relevant because they may influence teacher well-being, which in this study is conceptualized through two job-satisfaction dimensions.
Dimensions of Teacher Well-Being
Teacher well-being in this study is conceptualized through two dimensions of job satisfaction: satisfaction with the immediate work environment (JSWENV) and satisfaction with the teaching profession itself (JSPROF). JSWENV captures teachers’ perceptions of their current work environment, including whether they enjoy working at the school, would recommend it as a good place to work, or would like to change schools if possible. JSPROF captures broader professional attitudes, including whether the advantages of teaching outweigh the disadvantages, whether teachers would choose the profession again, and whether they regret becoming teachers (OECD, 2020d; Skaalvik & Skaalvik, 2011; 2018; Viac & Fraser, 2020). This distinction is important because JD-R dynamics may affect these dimensions differently. School-level resources may sustain JSWENV even when professional demands erode JSPROF, while strong professional commitment may buffer against poor work-environment conditions.
JD-R and Country-level Resilience
Although JD-R was developed for individual and organizational levels, it can also inform country-level analysis when national education systems are treated as contextual environments shaping teachers’ conditions (Viac & Fraser, 2020). In this study, country-level TALIS indicators are used as aggregate expressions of teacher-perceived demands, resources, and well-being. The resilience score is therefore treated as a comparative indicator of how well a system absorbs post-pandemic pressures while sustaining teacher well-being and instructional capacity (Bakker et al., 2023; Masten, 2001; Viac & Fraser, 2020).
This perspective is particularly relevant after the pandemic. Teachers faced learning recovery pressures, intensified student behavioural needs, administrative burdens, and ongoing equity demands, while decisions about professional support and implementation capacity were made at the country level (Avidov-Ungar et al., 2025; OECD, 2020b; 2023; Viac & Fraser, 2020). From a JD-R perspective, countries showing greater resilience are those that contained demand growth while maintaining or expanding professional resources (Lähteenmäki et al., 2025).
Analytical Expectations
In this study, governance is treated as a contextual condition that may influence how education systems organise demand-resource trade-offs during recovery, rather than as a direct cause of teacher well-being outcomes. The central expectation is that countries that contain demand growth while maintaining or expanding professional resources will show more favourable teacher well-being trajectories (Bakker & Demerouti, 2007; Bakker et al., 2023; Viac & Fraser, 2020). Accordingly, four JD-R-based patterns are used to interpret the country-level trajectories. The following labels adapt JD-R concepts to country-level patterns: (a) Gain-spiral resilience refers to situations where resources generate engagement and further resources while demands are contained (Bakker & Demerouti, 2017; Bakker et al., 2023). (b) Demand-expanding strain captures dynamics where demands create strain faster than resources can offset (Bakker & Demerouti, 2007; Bakker et al., 2023). (c) Loss-spiral vulnerability describes situations where initial resource depletion triggers escalating losses and deteriorating well-being (Bakker & Demerouti, 2017; Bakker et al., 2023). (d) Equilibrium stability reflects JD-R balance where demands and resources are roughly matched, producing relative stability (Bakker & Demerouti, 2007; Bakker et al., 2023).
Methods
Data and Sample
This study uses OECD TALIS 2018 and 2024 public-use files. All of the five Nordic countries, four (Denmark, Finland, Iceland, Norway, and Sweden) participated in both cycles, but Iceland was excluded from the analyses because its 2018 data is unavailable in the public-use files. Analyses focused on nationally representative lower-secondary teachers (ISCED Level 2). Sample sizes were Denmark (2018: n = 7,342; 2024: n = 4,737-5,038), Finland (2018: n = 2,851; 2024: n = 4,243-4,300), Norway (2018: n = 4,154; 2024: n = 1,279-1,528), and Sweden (2018: n = 8,119; 2024: n = 2,530-3,065). The 2024 sample size varies by scale because of the rotated questionnaire design (OECD, 2025e). Analyses applied teacher weights (TCHWGT) to adjust for the stratified two-stage cluster design (OECD, 2019b; 2025e). Analyses were conducted in R using the survey, tidyverse, lavaan, and mice packages.
Measurement of Constructs
Three domains were operationalized: teacher professional development, teaching practices, and well-being. Variables were renamed following OECD trend mapping to align the 2018 (TT3G-prefixed) and 2024 (TT4G-prefixed) instruments, and a binary cycle indicator (0 = 2018; 1 = 2024) was added for cross-cycle comparison (OECD, 2019b; 2025e). Table 2 summarises the constructs, measures, and scale types used in the analysis.
Teacher professional development was measured with the composite PDTOPICS, derived from the mean of two binary subscales: PDTCORE (core pedagogical competencies) and PDINCLAS (inclusive classroom practices). Both subscales were based on TALIS items asking whether specific topics were included in teachers’ professional development or professional learning activities during the previous 12 months. PDTCORE comprised six items on subject knowledge, pedagogical competencies in teaching the subject, curriculum, student assessment practices, analysis and use of student assessment, and ICT or digital pedagogical skills. PDINCLAS comprised four items on student behaviour and classroom management, approaches to individualised learning, teaching students with special needs, and teaching in multicultural or multilingual settings (OECD, 2019b; 2025e).
Teaching practices and well-being were measured using existing TALIS scale composites. The teaching practices composite TPCOMP combines mean of TPCLAIN (clarity of instruction), TPCOGAC (cognitive activation), and TPCLASM (classroom management), following the TALIS teaching practices model (Klieme et al., 2009; OECD, 2019a). Well-being was assessed through WKSTRESS (work-related stress) and JOBSAT (job satisfaction), with WKSTRESS derived from the mean of WPSTRESS (workplace stress) and WLSTRESS (workload stress), and JOBSAT was derived from the mean of JSWENV (job satisfaction with work environment) and JSPROF (job satisfaction with profession). Professional development indicators were coded as binary proportions (0-1), where 1 indicates participation in at least one of the listed professional development topics during the previous 12 months, while teaching-practice and well-being measures were treated as Likert-type scales (1-4), with higher scores indicating greater frequency or stronger agreement.
Table 2. Summary of Constructs and Measures
|
Construct |
Measure / source |
Domain / type |
|
PDTCORE |
Core pedagogical competencies; derived from 6 TALIS items on subject knowledge, pedagogy, curriculum, student assessment practices, analysis and use of student assessment, and ICT/digital pedagogical skills (2018: TT3G23A, B, C, D, L, E; 2024: TT4G21A, B, C, D, M, E) |
PD (Subscale) |
|
PDINCLAS |
Inclusive classroom practices; derived from 4 TALIS items on classroom management, individualised learning, teaching students with special needs, and teaching in multicultural or multilingual settings (2018: TT3G23F, H, I, J; 2024: TT4G21H, J, K, L) |
PD (Subscale) |
|
PDTOPICS |
Professional development; Composite of PDTCORE and PDINCLAS |
PD (Composite) |
|
TPCLAIN |
TALIS scale: Clarity of instruction |
TP (Subscale) |
|
TPCOGAC |
TALIS scale: Cognitive activation |
TP (Subscale) |
|
TPCLASM |
TALIS scale: Classroom management |
TP (Subscale) |
|
TPCOMP |
Teaching practices; Composite of TPCLAIN, TPCOGAC, and TPCLASM |
TP (Composite) |
|
WPSTRESS |
TALIS scale: Workplace stress |
WB (Subscale) |
|
WLSTRESS |
TALIS scale: Workload stress |
WB (Subscale) |
|
WKSTRESS |
Work-related stress; Composite of WPSTRESS and WLSTRESS |
WB (Composite) |
|
JSWENV |
TALIS scale: Job satisfaction with work environment |
WB (Subscale) |
|
JSPROF |
TALIS scale: Job satisfaction with profession |
WB (Subscale) |
|
JOBSAT |
Job satisfaction; Composite of JSWENV and JSPROF |
WB (Composite) |
Note. PDTCORE, PDINCLAS, and PDTOPICS were derived from TALIS item responses and aggregated using teacher weights (TCHWGT). Existing TALIS scales were used for teaching practices and well-being as specified in the OECD codebooks. Item-level mappings for teaching-practice and well-being scales are therefore not repeated here. PD = professional development, TP = teaching practices, WB = well-being.
Psychometric Validation and Missing Data Management
Confirmatory factor analyses using the Weighted Least Squares Means and Variance adjusted (WLSMV) estimator were conducted for all scales, given that the analysed scales were used across countries and cycles. In addition, because the TALIS 2018 and 2024 instruments differ for the job satisfaction and well-being scales, and because the professional development measures (PDTCORE, PDINCLAS, and PDTOPICS) were derived from TALIS item responses, all scales were subjected to psychometric validation. Ordinal Cronbach’s alpha ranged from 0.787 to 0.904, exceeding the conventional 0.70 benchmark. Multi-group CFA indicated full scalar invariance across countries and cycles (|ΔCFI| ≤ 0.005), supporting country-level latent mean comparisons (Cheung & Rensvold, 2002). Most scales showed excellent fit (CFI/TLI ≥ 0.98, SRMR ≤ 0.04), while slightly elevated RMSEA values for TPCOGAC and TPCLASM were within the range commonly observed for WLSMV estimation with ordinal data (DiStefano et al., 2019).
Item-level non-response differed across cycles (Ainley & Carstens, 2018; OECD, 2025a). In 2018, true item non-response was below 20% for all composite scales, including JOBSAT (4.2%), PDTOPICS (7.4%), TPCOMP (17.2%), and WKSTRESS (3.4%). In 2024, TALIS used a rotated questionnaire design, so some teaching-practice items and WLSTRESS were not administered to a subset of teachers by design; this planned non-administration was not treated as true item missingness. True item non-response in 2024 was lower, ranging from 0.48% to 5.9%. The remaining true missing data in both cycles were addressed using multiple imputation by chained equations (MICE; 20 imputations) (Buuren & Groothuis-Oudshoorn, 2011; Rubin, 1987).
Analytical Strategy and Resilience Operationalization
The analysis compares weighted national means for 2018 and 2024, reporting absolute and percentage change for each country and construct. Because only four countries and two time points are analysed, the study uses comparative description and pattern-matching logic to examine whether observed trajectories align with JD-R expectations (Green & Janmaat, 2011a; Lazcano et al., 2025; Yin, 2014).
The resilience score (RS) combines standardized changes in job satisfaction and work-related stress across the four countries using Z-scores. Resilience score is calculated in three steps. First, the raw change in job satisfaction (ΔJOBSAT) and the raw change in work‑related stress (ΔWKSTRESS) are computed for each country as the difference between the 2024 and 2018 weighted national means. Second, these raw changes are standardised into Z‑scores using the mean and standard deviation of the four Nordic countries as the reference population. Specifically, for ΔJOBSAT, the mean of the four countries’ changes is subtracted from each country’s ΔJOBSAT, and the result is divided by the standard deviation of the four ΔJOBSAT values. The same standardisation is applied independently to ΔWKSTRESS. Third, the resilience score is calculated as the standardised change in job satisfaction minus the standardised change in work‑related stress: resilience score (RS) = Z(ΔJOBSAT) - Z(ΔWKSTRESS).
A positive resilience score indicates that job satisfaction improved, or declined less, relative to peers while stress worsened less, or improved more, corresponding to a more resilient profile. A negative resilience score indicates the opposite pattern or strain, and a near-zero resilience score indicates relative equilibrium. The resilience scores are interpreted in the Results and Discussion within the JD-R framework as indicating gain-spiral resilience, equilibrium stability, demand-expanding strain, or loss-spiral vulnerability (Bakker & Demerouti, 2007; 2018; Bakker et al., 2023; Masten, 2001; OECD, 2025a; Viac & Fraser, 2020). Standardisation ensures both components are expressed in comparable units before subtraction, which is necessary because job satisfaction and work-related stress are measured on different raw scales.
Drawing on the governance typologies in Table 1, the study classifies each national case according to the country-level JD-R pattern it most closely resembles. The classification is based on the four interpretive labels developed from the JD-R framework: gain-spiral resilience, demand-expanding strain, loss-spiral vulnerability, and equilibrium stability. This is an exploratory classification exercise and is not intended as a causal test of governance effects.
Additionally, because the study includes only four countries and two time points, the analysis is descriptive and pattern-based rather than causal. It cannot test governance as a direct determinant of well-being, but it can examine whether observed national trajectories align with JD-R expectations from the framework. Differential teacher attrition between 2018 and 2024 and unmeasured confounders, such as pandemic severity and economic conditions, may contribute to observed patterns, so the findings should be interpreted cautiously.
Results
Professional Development Trajectories (RQ1)
Table 3. Professional development (2018-2024)
|
Country |
PDTCORE (2018) |
PDTCORE (2024) |
Change (%) |
PDINCLAS (2018) |
PDINCLAS (2024) |
Change (%) |
PDTOPICS (2018) |
PDTOPICS (2024) |
Change (%) |
|
DNK |
0.531 |
0.468 |
-11.9 |
0.248 |
0.262 |
+5.6 |
0.390 |
0.366 |
-6.2 |
|
FIN |
0.687 |
0.460 |
-33.0 |
0.306 |
0.340 |
+11.1 |
0.496 |
0.401 |
-19.2 |
|
NOR |
0.616 |
0.636 |
+3.2 |
0.305 |
0.443 |
+45.3 |
0.461 |
0.539 |
+16.9 |
|
SWE |
0.531 |
0.489 |
-7.9 |
0.387 |
0.440 |
+13.7 |
0.459 |
0.465 |
+1.3 |
Note. Professional development indicators are binary proportions (0-1). Values are weighted national means representing the proportion of teachers who participated in each professional development topic.
Figure 1. Professional
Development Trajectories (TALIS 2018-2024)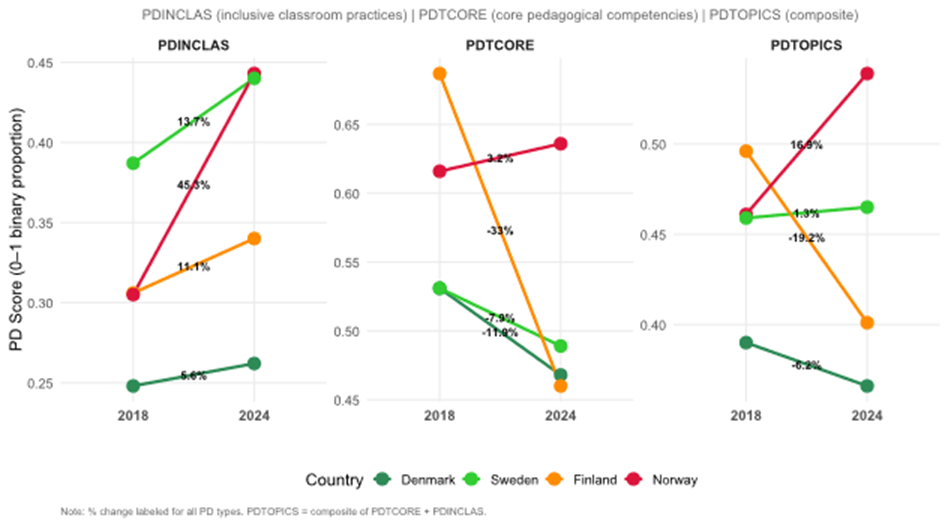
Figure 1 shows contrasting professional development patterns, with Finland declining most in PDTCORE and Norway rising most in PDTCORE and PDINCLAS.
Teaching Practice Trajectories (RQ2)
Table 4 summarizes the country means and change across the three teaching practice domains. Teaching practices increased overall, especially in classroom management (TPCLASM). Classroom management increased in all four countries, most strongly in Sweden (+12.4%). Clarity of instruction (TPCLAIN) also increased across countries, while cognitive activation (TPCOGAC) was comparatively stable and slightly declined in Finland (-2.0%) and Sweden (-1.0%). These divergent trajectories across teaching practice domains are presented visually in Figure 2.
Table 4. Changes in Teaching Practice (2018-2024)
|
Country |
TPCLAIN (2018) |
TPCLAIN (2024) |
Change (%) |
TPCOGAC (2018) |
TPCOGAC (2024) |
Change (%) |
TPCLASM (2018) |
TPCLASM (2024) |
Change (%) |
TPCOMP (2018) |
TPCOMP (2024) |
Change (%) |
|
DNK |
2.917 |
3.029 |
+3.8 |
2.538 |
2.607 |
+2.7 |
2.802 |
2.883 |
+2.9 |
2.753 |
2.839 |
+3.2 |
|
FIN |
2.794 |
3.004 |
+7.5 |
2.262 |
2.218 |
-2.0 |
2.798 |
3.117 |
+11.4 |
2.618 |
2.780 |
+6.2 |
|
NOR |
2.973 |
3.014 |
+1.4 |
2.568 |
2.627 |
+2.3 |
2.739 |
3.026 |
+10.5 |
2.760 |
2.889 |
+4.7 |
|
SWE |
3.012 |
3.192 |
+6.0 |
2.329 |
2.306 |
-1.0 |
2.702 |
3.037 |
+12.4 |
2.681 |
2.846 |
+6.1 |
Note. Values are weighted national means on a 1-4 scale. Higher values indicate greater reported frequency.
Figure 2. Teaching Practices Trajectories (TALIS2018-2024)
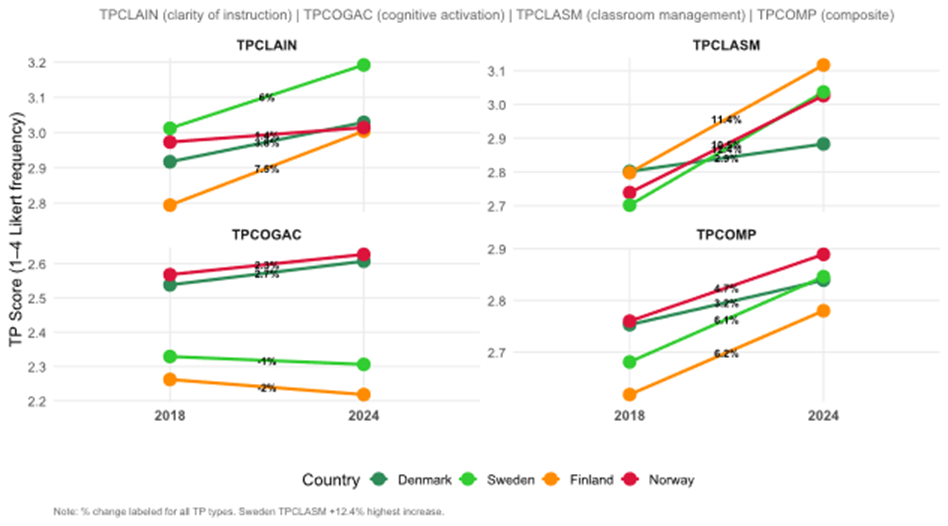
Figure 2 shows that classroom management increased more consistently than cognitive activation across countries.
Teacher Well-being Trajectories (RQ3)
Table 5 presents the full set of well-being indicators, while Figures 3 and 4 display the satisfaction and stress patterns. Table 5 reveals that teacher well-being changed in different directions across the four systems. Denmark showed lower work-related stress (-7.9%) and slightly higher job satisfaction (+1.7%). Norway showed the largest increase in work-related stress (+9.8%) and the largest decline in job satisfaction (-4.3%). Finland and Sweden showed smaller changes, with modest increases in stress (Finland: +4.8%; Sweden: +1.8%) and slight declines in job satisfaction (Finland: -2.0%; Sweden: -0.3%).
Table 5. Teacher Well-being Indicators (2018-2024)
|
Country |
Indicator |
2018 Mean |
2024 Mean |
Absolute Change |
Percentage Change (%) |
|
|
|
|
|
|
|
|
DENMARK |
WPSTRESS |
2.179 |
2.104 |
-0.075 |
-3.4 |
|
WLSTRESS |
2.633 |
2.307 |
-0.326 |
-12.4 |
|
|
WKSTRESS |
2.375 |
2.188 |
-0.187 |
-7.9 |
|
|
JSWENV |
3.302 |
3.298 |
-0.004 |
-0.1 |
|
|
JSPROF |
3.116 |
3.232 |
+0.116 |
+3.7 |
|
|
JOBSAT |
3.208 |
3.264 |
+0.056 |
+1.7 |
|
|
|
|
|
|
|
|
|
FINLAND |
WPSTRESS |
1.945 |
2.051 |
+0.106 |
+5.4 |
|
WLSTRESS |
1.897 |
1.956 |
+0.059 |
+3.1 |
|
|
WKSTRESS |
1.920 |
2.012 |
+0.092 |
+4.8 |
|
|
JSWENV |
3.103 |
3.094 |
-0.009 |
-0.3 |
|
|
JSPROF |
3.228 |
3.114 |
-0.114 |
-3.5 |
|
|
JOBSAT |
3.165 |
3.103 |
-0.062 |
-2.0 |
|
|
|
|
|
|
|
|
|
NORWAY |
WPSTRESS |
1.907 |
2.343 |
+0.436 |
+22.9 |
|
WLSTRESS |
2.315 |
2.360 |
+0.045 |
+1.9 |
|
|
WKSTRESS |
2.141 |
2.351 |
+0.210 |
+9.8 |
|
|
JSWENV |
3.301 |
3.291 |
-0.010 |
-0.3 |
|
|
JSPROF |
3.173 |
2.905 |
-0.268 |
-8.4 |
|
|
JOBSAT |
3.236 |
3.098 |
-0.138 |
-4.3 |
|
|
|
|
|
|
|
|
|
SWEDEN |
WPSTRESS |
2.074 |
2.129 |
+0.055 |
+2.7 |
|
WLSTRESS |
2.375 |
2.533 |
+0.158 |
+6.7 |
|
|
WKSTRESS |
2.225 |
2.265 |
+0.040 |
+1.8 |
|
|
JSWENV |
3.218 |
3.202 |
-0.016 |
-0.5 |
|
|
JSPROF |
3.109 |
3.107 |
-0.002 |
-0.1 |
|
|
JOBSAT |
3.163 |
3.154 |
-0.009 |
-0.3 |
Note: Values are weighted national means. Work-related stress and job satisfaction are measured on a 1-4 scale.
Figure 3. Well-being Job Satisfaction Trajectories (TALIS2018-2024)
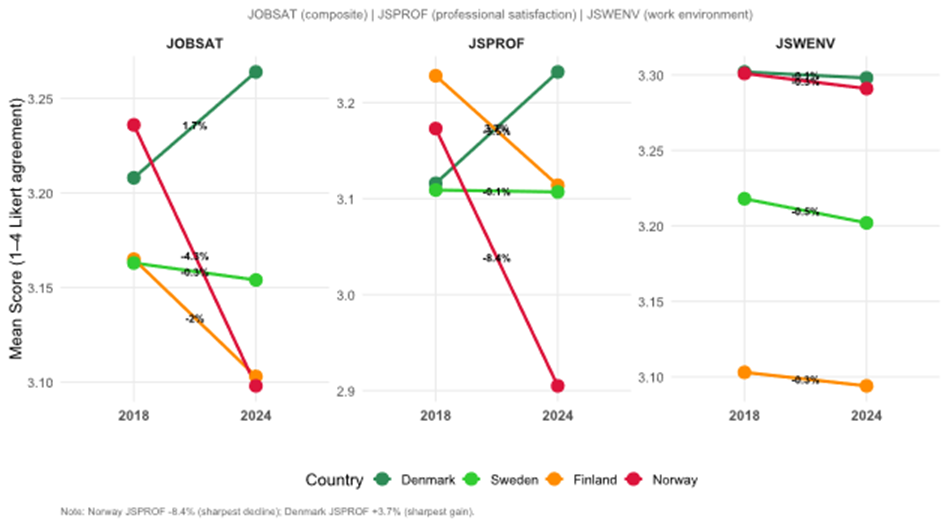
Figure 3 shows job satisfaction increasing in Denmark and declining slightly in Norway, Finland, and Sweden.
Figure 4. Well-being Workplace Stress Trajectories (TALIS2018-2024)
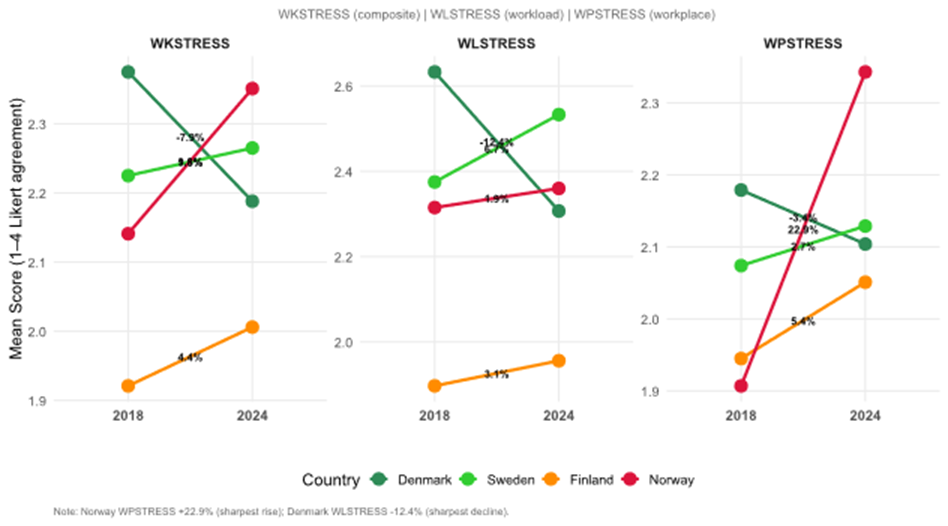
Figure 4 shows stress increasing in Norway, Finland, and Sweden, but decreasing in Denmark.
Country-Level and JD-R Profiles (RQ4)
The resilience scores in Table 6 and Figure 5 show four distinct country profiles. Denmark has the strongest positive score (+2.89), followed by Sweden (+0.19), while Finland and Norway have negative scores. Interpreted through the JD-R framework, Denmark reflects gain-spiral resilience, Sweden reflects relative equilibrium, Finland reflects demand-expanding strain, and Norway reflects loss-spiral vulnerability. These four distinct national trajectories span a 5.42-point resilience range.
Table 6. Resilience Scores and JD-R Profiles (2018-2024)
|
Country |
JOBSAT Score (2018) |
JOBSAT Score (2024) |
JOBSAT Change |
WKSTRESS Score (2018) |
WKSTRESS Score (2024) |
WKSTRESS Change |
RS Score |
95% CI |
JD-R Profile |
|
Denmark |
3.208 |
3.264 |
+0.056 |
2.375 |
2.188 |
-0.187 |
+2.89 |
(2.86, 2.92) |
Gain-spiral (resilient) |
|
Sweden |
3.163 |
3.154 |
-0.009 |
2.225 |
2.265 |
+0.040 (+1.80%) |
+0.19 |
(0.16, 0.22) |
Equilibrium (stable) |
|
Finland |
3.165 |
3.103 |
-0.062 |
1.921 |
2.006 |
+0.085 (+4.42%) |
-0.54 |
(-0.57, -0.51) |
Strain (demand-expanding) |
|
Norway |
3.236 |
3.098 |
-0.138 |
2.141 |
2.351 |
+0.210 (+9.81%) |
-2.53 |
(-2.57, -2.49) |
Loss-spiral (vulnerable) |
Note: Resilience Score (RS) = Z(ΔJOBSAT) - Z(ΔWKSTRESS). Higher scores indicate more favourable balance between job satisfaction and work-related stress.
Figure 5. Country-Level Resilience Scores of Four Nordic Countries (TALIS2018-2024)
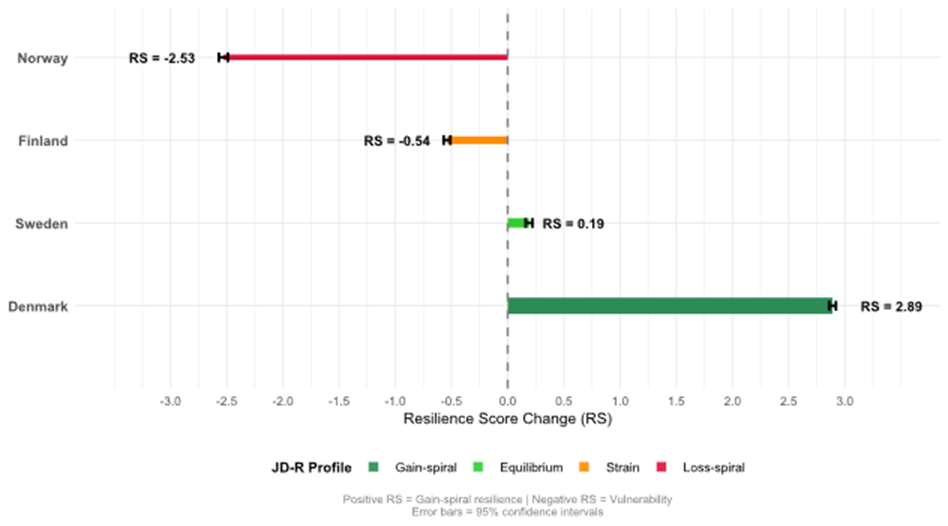
Figure 5 shows four distinct resilience profiles. Denmark recorded the highest score (+2.89), Norway the lowest (-2.53), while Sweden (+0.19) and Finland (-0.54) had intermediate scores.
Discussion
Professional Development and Resource Reallocation (RQ1)
The professional development trajectories suggest that the four Nordic systems responded to the post-pandemic period through different forms of resource reallocation rather than through a common regional strategy. In all four countries, inclusive classroom practices expanded, most notably in Norway (+45.3%), while core pedagogical competencies declined in three systems, especially in Finland (-33.0%). From a JD-R perspective, this suggests that systems may have prioritized equity-oriented and immediately responsive learning needs over broader pedagogical deepening when demands intensified, consistent with the idea that professional resources are reorganized under pressure rather than simply expanded (Bakker & Demerouti, 2007; 2018; Collie et al., 2020).
Denmark appears comparatively balanced because it combined a moderate contraction in core pedagogical competencies (-11.9%) with a modest increase in inclusive classroom practices (+5.6%), alongside reduced work-related stress (-7.9%) and improved job satisfaction (+1.7%). Finland presents a less favourable picture: the sharp decline in core pedagogical competencies (-33.0%), together with rising work-related stress (+4.8%) and lower job satisfaction (-2.0%), suggests that professional development contracted precisely when strain was increasing. Norway shows the strongest expansion in inclusive classroom practices (+45.3%), but this did not translate into lower stress; rather, work-related stress increased sharply (+9.8%) and job satisfaction declined (-4.3%), indicating that resource expansion alone was not sufficient to contain pressure. Sweden occupies a middle position, with a decline in core pedagogical competencies (-7.9%) but growth in inclusive classroom practices (+13.7%) and only limited movement in well-being, suggesting partial adjustment rather than clear recovery.
Teaching Practice and Instructional Trade-Offs (RQ2)
The teaching-practice results point to a shared post-pandemic shift toward classroom management rather than cognitively demanding instruction. Across the four countries, classroom management intensified more consistently than cognitive activation, which suggests that teachers were responding first to immediate classroom pressures before extending students’ higher-order learning opportunities. In JD-R terms, this resembles a demand-imposed coping pattern in which teachers prioritize order and stability when instructional conditions become more demanding (Bakker & Demerouti, 2007).
Denmark again stands out as the least strained case. It preserved gains in cognitive activation (+2.7%) while limiting growth in classroom management (+2.9%) and reducing stress (-7.9%), suggesting a more coordinated instructional response. Finland and Sweden, by contrast, show a stronger tilt toward classroom management, with cognitive activation weakening or stagnating (-2.0% in Finland and -1.0% in Sweden), which may indicate that recovery work was being absorbed by behavioural regulation rather than by deepening instruction. Norway also increased classroom management substantially (+10.5%), but unlike Denmark it did so alongside a sharper rise in stress (+9.8%), pointing to greater pressure on teachers’ adaptive capacity.
This interpretation should remain cautious. TALIS does not directly measure student behaviour changes or teacher time allocation, so the apparent trade-off between cognitive activation and classroom management should be treated as suggestive rather than causal evidence. Even so, the recurrence of this pattern in three systems points to structural constraints rather than isolated classroom-level choices, especially when viewed together with the well-being data.
Well-Being and Professional Identity (RQ3)
The well-being findings indicate that post-pandemic recovery was uneven across the Nordic countries and that the two dimensions of job satisfaction moved differently. Norway shows the sharpest deterioration in job satisfaction with profession (-8.4%), while job satisfaction with work environment remained broadly stable (-0.3%), suggesting that strain is rooted more in professional identity and broader occupational pressures than in immediate school climate alone. In JD-R terms, the rise in workplace stress (+22.9%) appears to have eroded teachers’ sense of professional purpose even where local working conditions changed less dramatically, which is consistent with loss-spiral vulnerability (Bakker & Demerouti, 2017; 2018; Bakker et al., 2023; Hakanen et al., 2006).
Denmark shows the opposite pattern. Job satisfaction with profession increased (+3.7%) while job satisfaction with work environment remained stable (-0.1%), indicating improved vocational appraisal without major change in local conditions. This aligns with gain-spiral resilience, where manageable workload and sustained support help preserve teachers’ sense of professional value and engagement (Bakker & Demerouti, 2017; Bakker et al., 2023; Hakanen et al., 2006). Sweden’s near-zero change in job satisfaction (-0.3%) suggests aggregate stability, but this should not be read as uniform resilience because market-oriented systems may preserve average scores while masking variation across schools and social contexts (Dovemark, 2014; Green & Janmaat, 2011b). Finland occupies an intermediate position: job satisfaction with profession declined (-3.5%) while job satisfaction with work environment remained stable (-0.3%), suggesting that expanded professional development did not fully offset rising pressure (Lähteenmäki et al., 2025).
Resilience Profiles Across Countries (RQ4)
The resilience scores provide a compact summary of these national trajectories. Denmark records the strongest positive profile (+2.89), Norway the weakest (-2.53), and Finland (-0.54) and Sweden (+0.19) occupy intermediate positions. This ordering broadly matches the study’s analytical expectations and is consistent with the interpretation that country-level resilience is related to how systems balance demands and resources over time rather than to professional development alone (Bakker & Demerouti, 2007; 2018; Collie et al., 2020; Collie et al., 2021). In that sense, the resilience score is best understood as a comparative indicator of the overall demand-resource balance, not as a direct measure of psychological resilience at the individual level.
The four profiles also suggest that governance architecture may function as a contextual condition influencing how systems respond to post-pandemic pressure. Denmark’s positive score is consistent with a framework-decentralised system that may support more coherent alignment between national steering and local implementation (Blossing et al., 2014; Rasmussen & Moos, 2014). Finland’s negative score suggests that autonomy-based governance can support flexibility in professional development while still struggling to contain demand growth (Ahonen, 2014; Chung, 2023; Haapaniemi et al., 2021; Sahlberg, 2015). Norway’s pattern is consistent with coordination challenges in multi-level governance, where expanding professional development does not necessarily translate into lower stress if workload pressures remain high (Frønes et al., 2020; Imsen & Volckmar, 2014). Sweden appears more stable at the aggregate level, although that stability may conceal internal inequality across schools and social contexts (Dovemark, 2014; Green & Janmaat, 2011b).
Governance as Context
Collectively, the findings do not show that governance determines outcomes mechanically. Rather, they suggest that governance architecture shapes how demands, resources, and teacher well-being are organized during recovery (Viac & Fraser, 2020). Denmark’s pattern is the clearest example of alignment: professional development shifted, stress fell, and job satisfaction rose, suggesting that support and workload protection moved in tandem. Norway shows a different configuration: professional development broadened, but stress also increased, indicating that resource provision alone is insufficient if demand management remains weak (Lennert da Silva, 2022).
Finland and Sweden sit between these poles, but for different reasons. Finland appears to have expanded inclusive classroom practices while allowing core pedagogical competencies to shrink and stress to rise, which points to a demand-resource mismatch during recovery. Sweden’s aggregate stability suggests a more balanced national profile, but that balance may conceal variation across school sectors and local settings in a market-oriented system. These patterns are analytically useful precisely because the study is comparative rather than causal; they indicate how governance may shape recovery without claiming direct policy determinism (Lennert da Silva, 2022; Viac & Fraser, 2020; Yin, 2014).
Policy Implications and Future Directions
Four policy implications follow from the findings. First, resource allocation needs to be paired with demand management. Finland’s contraction of core pedagogical competencies (-33.0%) alongside rising stress (+4.8%), and Norway’s large expansion in inclusive classroom practices (+45.3%) without stress reduction (+9.8%), both indicate that changes in professional development do not automatically improve well-being when workload pressures remain unaddressed (Aziku & Zhang, 2024; Bakker & Demerouti, 2018).
Second, sustaining cognitively activating instruction requires structural support rather than relying on individual teachers to absorb competing demands. Investment in student support services may help reduce behavioural burden and protect instructional quality, especially in systems where classroom management intensified sharply (Bergem et al., 2020; OECD, 2020b).
Third, coordination matters in crisis response. More coherent governance arrangements may make it easier to align resource provision with workload protection, especially in systems characterized by high decentralization or multiple administrative layers (OECD, 2019a; Viac & Fraser, 2020).
Fourth, the equity implications of declining inclusive classroom practices and reduced cognitive activation should be monitored explicitly. These patterns may affect students already facing disadvantage most strongly and should therefore be treated as a country-level concern rather than a classroom-level issue alone (Betthäuser et al., 2023; Frønes et al., 2020).
Limitations
This study acknowledges five limitations. It uses country-level observational data, so it cannot establish causal relationships between governance and teacher well-being. The analysis also relies on teacher-reported aggregate indicators, which are substantively important but do not directly measure policy implementation or school-level conditions. In addition, the resilience score is a descriptive comparative indicator rather than a validated psychological scale. Although alternative specifications preserved the ordinal country pattern, the measure should therefore be interpreted as descriptive rather than definitive (Smith et al., 2008). True item non-response was generally below 20% in both 2018 and 2024; however, the rotated questionnaire design in TALIS 2024 meant that some teaching-practice and workload-stress measures were not administered to all teachers by design, so cross-cycle estimates should be interpreted cautiously (Ainley & Carstens, 2018; OECD, 2025a; 2025e). Finally, national averages may conceal within-country variation, so future research should examine school-level patterns to assess whether aggregate stability masks local disparities (Ainley & Carstens, 2018; Corral-Granados et al., 2025; OECD, 2025).
Conclusion
This study shows that post-pandemic adaptation across the four Nordic education systems followed markedly different trajectories despite shared commitments to equity, inclusion, and teacher professionalism. Using TALIS 2018 and 2024 data, the analysis suggests that teacher well-being and system resilience were closely related to how professional resources and work-related demands were balanced over time, consistent with the Job Demands-Resources framework (Bakker & Demerouti, 2007; 2018; Viac & Fraser, 2020).
At the country level, Denmark most closely reflects gain-spiral resilience, Finland demand-expanding strain, Norway loss-spiral vulnerability, and Sweden aggregate equilibrium. These patterns indicate that resilience depends less on the simple presence of professional development than on whether systems align professional learning, instructional demands, and teacher well-being in coherent ways over time.
The broader implication is that shared commitments to equity and inclusion may not be sufficient on their own to secure resilient outcomes; what matters is how those commitments are translated into governance arrangements and concrete demand-resource decisions during periods of disruption (Buchholtz et al., 2020; Sundberg & Hovdhaugen, 2026). These findings are relevant beyond the Nordic region, especially for decentralised, autonomy-based, multi-level, and market-oriented education systems facing similar post-crisis pressures. Future research should use school-level TALIS data and longitudinal designs to test whether the resilience profiles identified here persist, converge, or diverge over time (Avidov-Ungar et al., 2025; OECD, 2025a).
References
Ahonen, S. (2014). A School for All in Finland. In U. Blossing, G. Imsen, & L. Moos (Eds.), The Nordic Education Model: "A School for All" Encounters Neo-Liberal Policy (pp. 77-93). Springer Netherlands. https://doi.org/10.1007/978-94-007-7125-3_5
Ainley, J., & Carstens, R. (2018). Teaching and Learning International Survey (TALIS) 2018 Conceptual Framework. OECD Education Working Papers, No. 187. OECD Publishing. https://doi.org/10.1787/799337c2-en
Avidov-Ungar, O., Hadad, S., Shamir-Inbal, T., & Blau, I. (2025). Formal and informal professional development during different Covid-19 periods: the role of teachers’ career stages. Professional Development in Education, 51(4), 666-682. https://doi.org/10.1080/19415257.2023.2174163
Aziku, M., & Zhang, B. (2024). Systematic review of teacher well-being research during the COVID-19 pandemic. Frontiers in Psychology, 15. https://doi.org/10.3389/fpsyg.2024.1427979
Bakker, A. B., & Demerouti, E. (2007). The Job Demands‐Resources model: State of the art. Journal of Managerial Psychology, 22(3), 309-328. https://doi.org/10.1108/02683940710733115
Bakker, A. B., & Demerouti, E. (2017). Job demands-resources theory: Taking stock and looking forward. Journal of Occupational Health Psychology, 22(3), 273-285. https://doi.org/10.1037/ocp0000056
Bakker, A. B., & Demerouti, E. (2018). Multiple Levels in Job Demands-Resources Theory: Implications for Employee Well-being and Performance. In E. Diener, S. Oishi, & L. Tay (Eds.), Handbook of Well-Being (pp. 555-566). DEF Publisher. https://www.isonderhouden.nl/doc/pdf/arnoldbakker/articles/articles_arnold_bakker_460.pdf
Bakker, A. B., Demerouti, E., & Sanz-Vergel, A. (2023). Job demands-resources theory: Ten years later. Annual Review of Organizational Psychology and Organizational Behavior, 10, 25-53. https://doi.org/10.1146/annurev-orgpsych-120920-053933
Bergem, O. K., Nilsen, T., Mittal, O., & Ræder, H. G. (2020). Can Teachers’ Instruction Increase Low-SES Students’ Motivation to Learn Mathematics? In T. S. Frønes, A. Pettersen, J. Radišić, & N. Buchholtz (Eds.), Equity, Equality and Diversity in the Nordic Model of Education (pp. 251-272). Springer International Publishing. https://doi.org/10.1007/978-3-030-61648-9_10
Betthäuser, B. A., Bach-Mortensen, A. M., & Engzell, P. (2023). A systematic review and meta-analysis of the evidence on learning during the COVID-19 pandemic. Nature Human Behaviour, 7(3), 375-385. https://doi.org/10.1038/s41562-022-01506-4
Blossing, U., Imsen, G., & Moos, L. (2014). The Nordic Education Model: "A School for All" Encounters Neo-Liberal Policy. Springer Netherlands. https://doi.org/10.1007/978-94-007-7125-3
Buchholtz, N., Stuart, A., & Frønes, T. S. (2020). Equity, Equality and Diversity-Putting Educational Justice in the Nordic Model to a Test. In T. S. Frønes, A. Pettersen, J. Radišić, & N. Buchholtz (Eds.), Equity, Equality and Diversity in the Nordic Model of Education (pp. 13-41). Springer International Publishing. https://doi.org/10.1007/978-3-030-61648-9_2
Buuren, S. van, & Groothuis-Oudshoorn, K. (2011). mice: Multivariate Imputation by Chained Equations in R. Journal of Statistical Software, 45, 1-67. https://doi.org/10.18637/jss.v045.i03
Carrillo, C., & Flores, M. A. (2020). COVID-19 and teacher education: a literature review of online teaching and learning practices. European Journal of Teacher Education, 43(4), 466-487. https://doi.org/10.1080/02619768.2020.1821184
Casely-Hayford, J., Johansson, S., Dutt, K. G., & Toropova, A. (2022). The role of job demands and resources for teacher job satisfaction: Insights from five European countries. In R. J. Tierney, F. Rizvi, & K. Ercikan (Eds.), International Encyclopedia of Education (4th ed.) (pp. 213-231). https://doi.org/10.1016/B978-0-12-818630-5.04082-3
Cheung, G. W., & Rensvold, R. B. (2002). Evaluating Goodness-of-Fit Indexes for Testing Measurement Invariance. Structural Equation Modeling: A Multidisciplinary Journal, 9(2), 233-255. https://doi.org/10.1207/S15328007SEM0902_5
Christensen, T., Jensen, M. D., Kluth, M., Kristinsson, G. H., Lynggaard, K., Lægreid, P., Niemikari, R., Pierre, J., Raunio, T., & Adolf Skúlason, G. (2023). The Nordic governments’ responses to the Covid-19 pandemic: A comparative study of variation in governance arrangements and regulatory instruments. Regulation & Governance, 17(3), 658-676. https://doi.org/10.1111/rego.12497
Chung, J. (2023). Research-informed teacher education, teacher autonomy and teacher agency: The example of Finland. London Review of Education, 21(1). https://doi.org/10.14324/LRE.21.1.13
Collie, R. J. (2023). Teacher well-being and turnover intentions: Investigating the roles of job resources and job demands. British Journal of Educational Psychology, 93(3), 712-726. https://doi.org/10.1111/bjep.12587
Collie, R. J., Malmberg, L.-E., Martin, A. J., Sammons, P., & Morin, A. J. S. (2020). A Multilevel Person-Centered Examination of Teachers’ Workplace Demands and Resources: Links With Work-Related Well-Being. Frontiers in Psychology, 11. https://doi.org/10.3389/fpsyg.2020.00626
Collie, R. J., Martin, A. J., Morin, A. J. S., Malmberg, L.-E., & Sammons, P. (2021). A Multilevel Person-Centered Examination of Teachers’ Workplace Experiences: Replication and Extension With Links to Instructional Support and Achievement. Frontiers in Psychology, 12. https://doi.org/10.3389/fpsyg.2021.711173
Corral-Granados, A., Rapp, A. C., & Smeplass, E. (2025). Nordic challenges related to exclusion and local responses in Swedish, Finnish, and Norwegian urban compulsory education. Education Inquiry, 16(1), 37-68. https://doi.org/10.1080/20004508.2022.2163002
Darling-Hammond, L., Hyler, M. E., & Gardner, M. (2017). Effective teacher professional development. Learning Policy Institute. https://learningpolicyinstitute.org/sites/default/files/product-files/Effective_Teacher_Professional_Development_REPORT.pdf
Demerouti, E., Bakker, A. B., Nachreiner, F., & Schaufeli, W. B. (2001). The job demands-resources model of burnout. Journal of Applied Psychology, 86(3), 499-512. https://doi.org/10.1037/0021-9010.86.3.499
Desimone, L. M. (2009). Improving impact studies of teachers’ professional development: Toward better conceptualizations and measures. Educational Researcher, 38(3), 181-199. https://doi.org/10.3102/0013189X08331140
DiStefano, C., McDaniel, H. L., Zhang, L., Shi, D., & Jiang, Z. (2019). Fitting Large Factor Analysis Models With Ordinal Data. Educational and Psychological Measurement, 79(3), 417-436. https://doi.org/10.1177/0013164418818242
Dovemark, M. (2014). A School for All? Different Worlds: Segregation on Basis of Freedom of Choice. In U. Blossing, G. Imsen, & L. Moos (Eds.), The Nordic Education Model: "A School for All" Encounters Neo-Liberal Policy (pp. 173-189). Springer Netherlands. https://doi.org/10.1007/978-94-007-7125-3_10
Frønes, T. S., Pettersen, A., Radišić, J., & Buchholtz, N. (2020). Equity, Equality and Diversity in the Nordic Model of Education-Contributions from Large-Scale Studies. In T. S. Frønes, A. Pettersen, J. Radišić, & N. Buchholtz (Eds.), Equity, Equality and Diversity in the Nordic Model of Education (pp. 1-10). Springer International Publishing. https://doi.org/10.1007/978-3-030-61648-9_1
Green, A., & Janmaat, J. G. (2011a). Quantitative Analysis of Regimes of Social Cohesion. In A. Green & J. G. Janmaat (Eds.), Regimes of Social Cohesion: Societies and the Crisis of Globalization (pp. 94-133). Palgrave Macmillan UK. https://doi.org/10.1057/9780230308633_6
Green, A., & Janmaat, J. G. (2011b). Value Diversity and Social Cohesion. In A. Green & J. G. Janmaat (Eds.), Regimes of Social Cohesion: Societies and the Crisis of Globalization (pp. 134-163). Palgrave Macmillan UK. https://doi.org/10.1057/9780230308633_7
Haapaniemi, J., Venäläinen, S., Malin, A., & Palojoki, P. (2021). Teacher autonomy and collaboration as part of integrative teaching - Reflections on the curriculum approach in Finland. Journal of Curriculum Studies, 53(4), 546-562. https://doi.org/10.1080/00220272.2020.1759145
Hakanen, J. J., Bakker, A. B., & Schaufeli, W. B. (2006). Burnout and work engagement among teachers. Journal of School Psychology, 43(6), 495-513. https://doi.org/10.1016/j.jsp.2005.11.001
Hall, C., Hardoy, I., & Lundin, M. (2022). Schooling in the Nordic countries during the COVID-19 pandemic (Working Paper No. 2022:13). Institute for Evaluation of Labour Market and Education Policy (IFAU), Uppsala. https://www.econstor.eu/bitstream/10419/273142/1/1810543533.pdf
Imsen, G., & Volckmar, N. (2014). The Norwegian School for All: Historical Emergence and Neoliberal Confrontation. In U. Blossing, G. Imsen, & L. Moos (Eds.), The Nordic Education Model: "A School for All" Encounters Neo-Liberal Policy (pp. 35-55). Springer Netherlands. https://doi.org/10.1007/978-94-007-7125-3_3
Klieme, E., Pauli, C., & Reusser, K. (2009). The Pythagoras study: Investigating effects of teaching and learning in Swiss and German mathematics classrooms. In T. Janík & T. Seidel (Eds.), The power of video studies in investigating teaching and learning in the classroom (pp. 137-160). Waxmann. https://doi.org/10.5167/uzh-29452
Lähteenmäki, S. F., Fagerström, L., Forsman, A., & Rauhala, A. (2025). Teachers’ well-being at work: A Finnish survey study on teachers’ work experiences. Cogent Education, 12(1), 2560058. https://doi.org/10.1080/2331186X.2025.2560058
Lazcano, C., Galilea, S., Wenderoth, S., Rojas, A., & Ortúzar, M. S. (2025). Exploring teacher job satisfaction in five Latin American countries: A Multi-level analysis using TALIS 2018. International Journal of Educational Research Open, 9. https://doi.org/10.1016/j.ijedro.2025.100516
Lennert da Silva, A. L. (2022). Comparing teacher autonomy in different models of educational governance. Nordic Journal of Studies in Educational Policy, 8(2), 103–118. https://doi.org/10.1080/20020317.2021.1965372
Magnússon, G. (2020). Inclusive education and school choice lessons from Sweden. European Journal of Special Needs Education, 35(1), 25-39. https://doi.org/10.1080/08856257.2019.1603601
Masten, A. S. (2001). Ordinary magic: Resilience processes in development. American Psychologist, 56(3), 227-238. https://doi.org/10.1037/0003-066X.56.3.227
Nøkleby, H., Langøien, L. J., Borge, T. C., & Johansen, T. B. (2024). Experiences and consequences of remote schooling during the Covid-19 pandemic for children and youth in the Nordic countries: A scoping review. London Review of Education, 22(1). https://doi.org/10.14324/LRE.22.1.39
OECD. (2019a). Education Policy Outlook 2019: Working Together to Help Students Achieve their Potential. OECD Publishing. https://doi.org/10.1787/2b8ad56e-en
OECD. (2019b). TALIS 2018 Technical Report. https://www.oecd.org/content/dam/oecd/en/about/programmes/edu/talis/talis2018supportmaterials/TALIS_2018_Technical_Report.pdf
OECD. (2020a). Education Policy Outlook in Denmark. OECD Education Policy Perspectives. https://doi.org/10.1787/3288629c-en
OECD. (2020b). Lessons for Education from COVID-19: A Policymaker’s Handbook for More Resilient Systems. OECD Publishing. https://doi.org/10.1787/0a530888-en
OECD. (2020c). Schooling disrupted, schooling rethought: How the Covid-19 pandemic is changing education. OECD Policy Responses to Coronavirus (COVID-19). https://doi.org/10.1787/68b11faf-en
OECD. (2020d). TALIS 2018 Results (Volume II): Teachers and School Leaders as Valued Professionals. OECD. https://doi.org/10.1787/19cf08df-en
OECD. (2021a). Education Policy Outlook 2021: Shaping Responsive and Resilient Education in a Changing World. OECD. https://doi.org/10.1787/75e40a16-en
OECD. (2021b). The State of School Education: One Year into the COVID Pandemic. OECD Publishing. https://doi.org/10.1787/201dde84-en
OECD. (2023). PISA 2022 Results (Volume II): Learning During - and From - Disruption. OECD. https://doi.org/10.1787/a97db61c-en
OECD. (2025a). Results from TALIS 2024 ‑ Country notes: Denmark. OECD Publishing. https://www.oecd.org/en/publications/results-from-talis-2024-country-notes_e127f9e2-en/denmark_f1739eb1-en.html
OECD. (2025b). Results from TALIS 2024 ‑ Country notes: Finland. OECD Publishing. https://www.oecd.org/en/publications/results-from-talis-2024-country-notes_e127f9e2-en/finland_ab17fae3-en.html
OECD. (2025c). Results from TALIS 2024 ‑ Country notes: Norway. OECD Publishing. https://www.oecd.org/en/publications/results-from-talis-2024-country-notes_e127f9e2-en/norway_3d989dd3-en.html
OECD. (2025d). Results from TALIS 2024 ‑ Country notes: Sweden. OECD Publishing. https://www.oecd.org/en/publications/results-from-talis-2024-country-notes_e127f9e2-en/sweden_95600eec-en.html
OECD. (2025e). Teaching and Learning International Survey (TALIS) 2024 Conceptual Framework. OECD Publishing. https://doi.org/10.1787/7b8f85d4-en
Rapanta, C., Botturi, L., Goodyear, P., Guàrdia, L., & Koole, M. (2021). Balancing Technology, Pedagogy and the New Normal: Post-pandemic Challenges for Higher Education. Postdigital Science and Education, 3(3), 715-742. https://doi.org/10.1007/s42438-021-00249-1
Rasmussen, A., & Moos, L. (2014). A School for Less Than All in Denmark. In U. Blossing, G. Imsen, & L. Moos (Eds.), The Nordic Education Model: "A School for All" Encounters Neo-Liberal Policy (pp. 57-75). Springer Netherlands. https://doi.org/10.1007/978-94-007-7125-3_4
Rubin, D. B. (1987). Multiple Imputation for Nonresponse in Surveys. Wiley. https://doi.org/10.1002/9780470316696
Sahlberg, P. (2015). Finnish lessons 2.0: What can the world learn from educational change in Finland? (2nd ed.). Teachers College Press.
Skaalvik, E. M., & Skaalvik, S. (2011). Teachers’ feeling of belonging, exhaustion, and job satisfaction: The role of school goal structure and value consonance. Anxiety, Stress & Coping, 24(4), 369-385. https://doi.org/10.1080/10615806.2010.544300
Skaalvik, E. M., & Skaalvik, S. (2018). Job demands and job resources as predictors of teacher motivation and well-being. Social Psychology of Education, 21(5), 1251-1275. https://doi.org/10.1007/s11218-018-9464-8
Smith, B. W., Dalen, J., Wiggins, K., Tooley, E., Christopher, P., & Bernard, J. (2008). The brief resilience scale: Assessing the ability to bounce back. International Journal of Behavioral Medicine, 15(3), 194-200. https://doi.org/10.1080/10705500802222972
Sundberg, R. A., & Hovdhaugen, E. (2026). Shared leadership and governance in Swedish and Norwegian schools: Implications for leadership autonomy in quality work. Nordic Journal of Comparative and International Education (NJCIE), 10(2). https://doi.org/10.7577/njcie.6467
Timperley, H., Wilson, A., Barrar, H., & Fung, I. (2007). Teacher professional learning and development: Best evidence synthesis iteration. Ministry of Education, New Zealand. https://www.educationcounts.govt.nz/publications/series/2515/15341
Viac, C., & Fraser, P. (2020). Teachers’ well-being: A framework for data collection and analysis. OECD Education Working Papers, No. 213. OECD Publishing. https://doi.org/10.1787/c36fc9d3-en
Wiksten, S. (2025). TALIS 2018 data indicates that teachers need support for developing skills in Pedagogical Decision Making. Nordic Journal of Comparative and International Education (NJCIE), 9(3). https://doi.org/10.7577/njcie.6058
Yin, R. K. (2014). Case Study Research: Design and Methods (5th ed.). SAGE Publications.
![]() ©2026
Kayode Moses Oluwafemi. This is an Open Access article distributed under the
terms of the Creative Commons Attribution 4.0 International License
(http://creativecommons.org/licenses/by/4.0/), allowing third parties to copy
and redistribute the material in any medium or format and to remix, transform,
and build upon the material for any purpose, even commercially, provided the
original work is properly cited and states its license.
©2026
Kayode Moses Oluwafemi. This is an Open Access article distributed under the
terms of the Creative Commons Attribution 4.0 International License
(http://creativecommons.org/licenses/by/4.0/), allowing third parties to copy
and redistribute the material in any medium or format and to remix, transform,
and build upon the material for any purpose, even commercially, provided the
original work is properly cited and states its license.